- Search Forex Factory
- 618 Results

-
 W0lfram replied Jun 5, 2024
after failure was fixed doesn't look like anything useful. On the x-axis London session candle body w/out NY, y-axis - full NY session, w/ overlap hours image
(binned per thread starter's request) Researching and testing

- W0lfram replied Jun 3, 2024
At first I couldn't understand why we got different clustering. When I set TP {x<0.0035} then plot is similar to yours My reasoning is as follows: take a sequence of consecutive highs after Hammer was detected find the max.value and its position in ...
(binned per thread starter's request) Researching and testing


- W0lfram replied Jun 2, 2024
I should have explained the variables, sorry. PosMax is a position in a sequence where the maximum high occurred. PosMin - position of lowest low I set tp in the interval {0.002 < x < 0.0035}, otherwise x>=0.0035 all the extreme DD comes out and ...
(binned per thread starter's request) Researching and testing


- W0lfram replied Jun 2, 2024
Dark cloud image 1. Without swing detection, only candle shape pc - previous candle cc - current candle [n] - history reference operator, i.e. close[2] - close 2 bars back image (*fail in comment, cc close < pc body mean) Found 1647 cases =~5.3% ...
(binned per thread starter's request) Researching and testing


- W0lfram replied Jun 2, 2024
Idk if I'm doing the same thing rn, but here is some thoughts: - Let's take TP {20 < x < 35} pips - analyze positions in a sequence at which TP was reached and position of min_price - on a scatter plot we would like to see points are clustered above ...
(binned per thread starter's request) Researching and testing

- W0lfram replied Jun 2, 2024
According to that empirical distribution - yes. it's a horror
(binned per thread starter's request) Researching and testing but I'll continue to test other patterns this way, even if its showing no_better_than_random results so far. For me SL, R:R are rather harmful concepts that put spoke in a wheel. ...


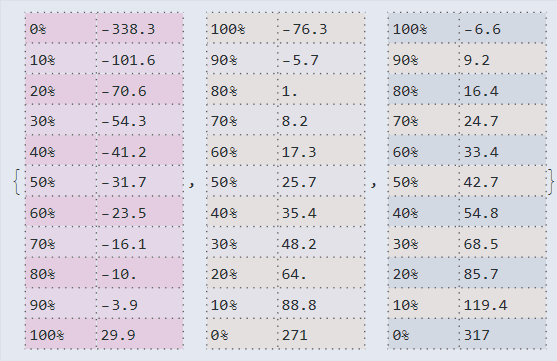
- W0lfram replied Jun 2, 2024
Important reference post Stats for GU, hourly If one decides to go short after any bearish candle and wait for (t) <=100 hours, there is 80% chance to gain 35 pips (green) If one decides to go long after any bearish candle and wait for (t) <=100 ...
(binned per thread starter's request) Researching and testing


- W0lfram replied Jun 1, 2024
Moin. I've added 'reversal detection' - or name it better, - based on Stochastic, because I saw that condition somewhere. lw - lower wick uw - upper wick bd - body sk - StochasticK with lenght=14 lw > (bd*2) && bd < 50 && uw < 2 && sk < 20 → (lower ...
(binned per thread starter's request) Researching and testing


- W0lfram replied May 30, 2024
I've used confusing terms here, sorry. Minimum - because is the lowest price in a sequence, so its actually maximum dd
(binned per thread starter's request) Researching and testing image After hammer appears, we see at the high/lows of the next 200 candles. 496 hammers was found. Thanks to ...

- W0lfram replied May 30, 2024
Thanns, PipMeUp for very useful suggestion. After dozens of random experiments the conclusion is (p-value varies, but..) The null hypothesis that the datasets have the same distribution is not rejected at the 5 percent level based on the ...
(binned per thread starter's request) Researching and testing


- W0lfram replied May 28, 2024
Starting with a Hammer. GU. Hourly tf. Dataset: 31 167 candles. lw - lower wick uw - upper wick bd - body && - logical operator 'and' Logical rules: lw > (bd*2) && bd < 50 && uw < 2 → (lower wick is 2 or more times bigger then a body, body occupies ...
(binned per thread starter's request) Researching and testing


- W0lfram replied May 24, 2024
Short @ 1.274, leaving it for a month tp ~ 1.26. High DD is ok (opportunity to add more orders) image image
Cable Update (GBPUSD)


- W0lfram replied May 17, 2024
Short @ 2392.0, tp ~ 2348, 2310 Gonna leave it for 30 days, high DD expected
Gold image
image

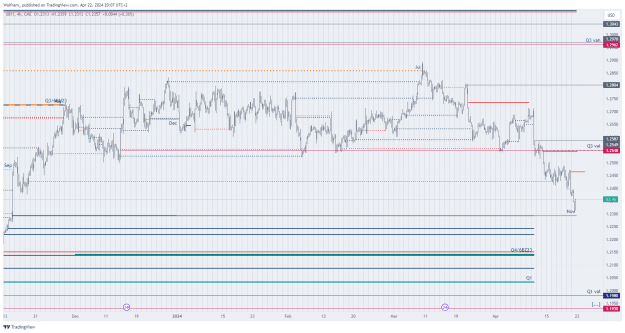
- W0lfram replied Apr 22, 2024
Some levels are there for a year now. Their time will come image The time of that candle will come as well Plan your trades and DD wisely
Cable Update (GBPUSD)
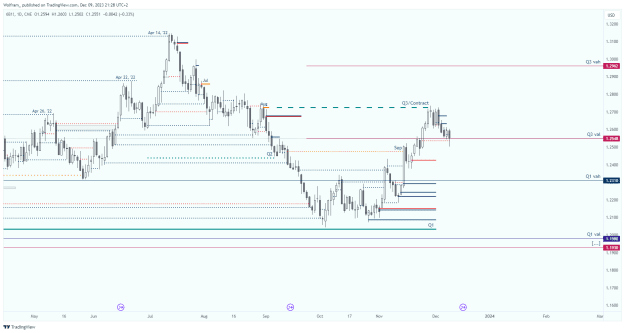
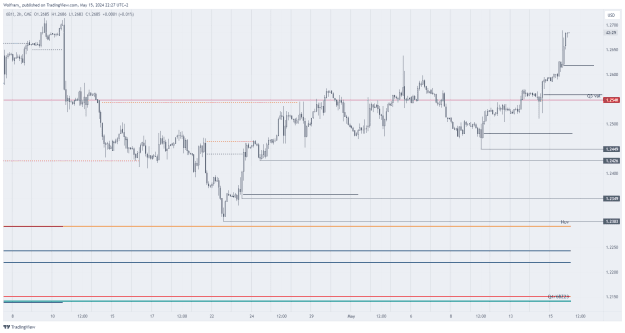
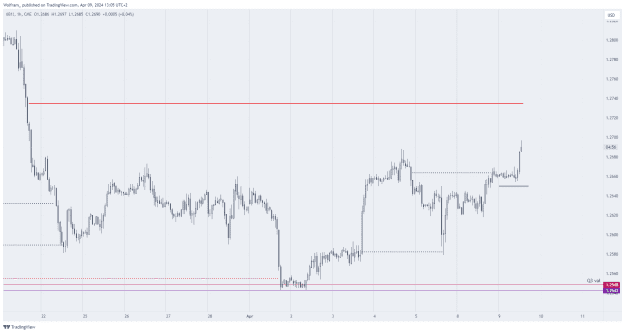
- W0lfram replied Apr 9, 2024
bulls are likely to go ~1.274 or even 1.28... Want to see how it finally breaks Q3 VAL, plenty of targets below image
Cable Update (GBPUSD)
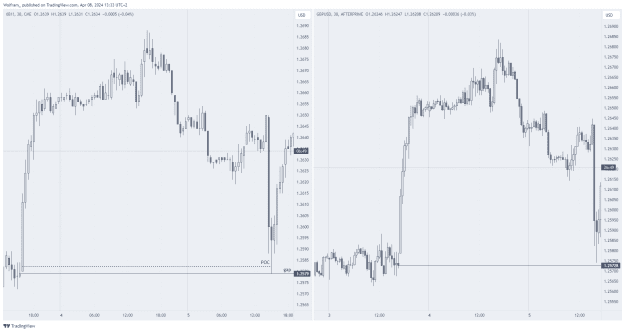
- W0lfram replied Apr 8, 2024
gaps doesn't exist in a high liquidity market
Cable Update (GBPUSD) image
image