- Search Forex Factory
- 37 Results (1 Threads, 36 Replies)

-
 QTraders replied May 31, 2024
image *Price hit the 5230 level and stopped at 5222. If the US open retests the low first I would expect a retrace back up. The level in blue is most likely
Liquidity - The solution to trading any market

- QTraders replied May 29, 2024
It appears that the fall in the SP500 that I thought might occur around the 17/18th May 2024 came in a little later than expected. It would appear that the first push is in the process of starting, Once price hits 5230 area, there should be a ...
Liquidity - The solution to trading any market

- QTraders replied May 21, 2024
image We have a liquidity void above the Asian/European session high, if we are going to drop this is the level I would look at.
Liquidity - The solution to trading any market

- QTraders replied May 21, 2024
Bitcoin is looking like it will turn soon: image
Liquidity - The solution to trading any market

- QTraders replied May 21, 2024
image We are still in a window for a SP500 turn, having touched two good ratios yesterday.
Liquidity - The solution to trading any market

- QTraders replied May 17, 2024
SP500 Analysis 17.5.2024 Today I am expecting a weak SP500, once I get the correct signal I will be looking to short the SP500 and look for a 300 pip target image
Liquidity - The solution to trading any market

- QTraders replied May 16, 2024
My ideal cycle top on the SP500 would be on the 17th/18th May. As we move up into this area, I have a couple of simple and complex tools I can use to help me estimate. First Method Simple deviation bands image Measure how far the swing moves from ...
Liquidity - The solution to trading any market


- QTraders replied May 15, 2024
image As we approach the higher time frame liquidity area, you can see the liquidity is coming into a level previously associated with a turn.
Liquidity - The solution to trading any market

- QTraders replied May 15, 2024
I used the price projection methods of Tom DeMark to see if I could find the last swing high. The calculation looks like this: image So using it on the current top it looks like this: image
Liquidity - The solution to trading any market


- QTraders replied May 10, 2024
BITCOIN 10-5-2024 image As anticipated Bitcoin is falling into a previous area, where buyers were active. I would anticipate a move higher on Saturday.
Bitcoin (BTCUSD)

- QTraders replied May 9, 2024
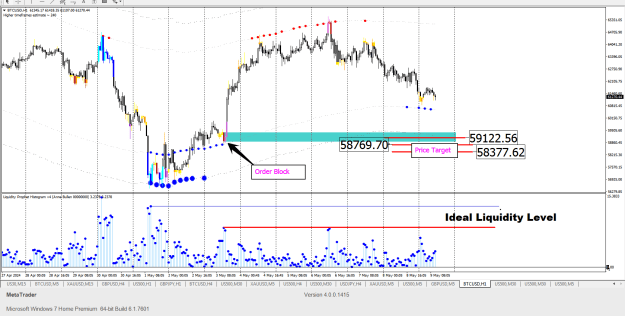
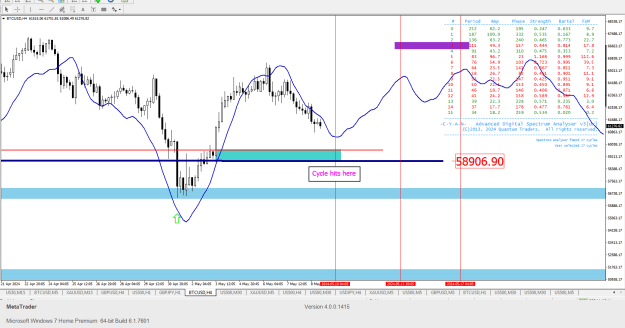
My Cycle Analysis tool suggest BTCUSD is possibly entering a cycle low. My chart show the possible price level to expect. image image
Bitcoin (BTCUSD)
- QTraders replied May 9, 2024
My BitCoin Cycle analysis points to a further decline in BitCoin. The ideal price levels are shown on the second chart. image image
Liquidity - The solution to trading any market


- QTraders replied May 7, 2024
SP500 7.May.2024 If the SP500 turn cycle appears today, these are the two price levels I will be watching image
Liquidity - The solution to trading any market

- QTraders replied May 6, 2024
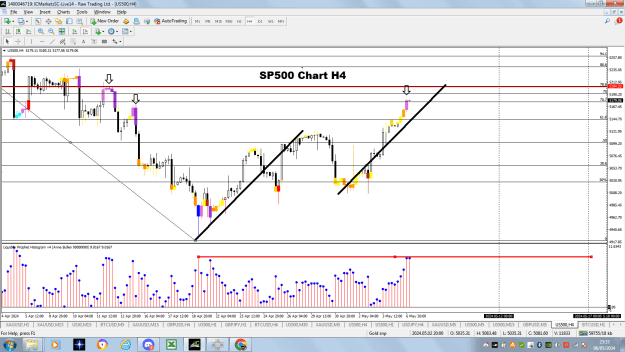
SP500 H4 image I think we might indeed roll over on the 7th; sometime in the US session I expect.
S&P500 trading
- QTraders replied May 6, 2024
If we turn on the 7th May in the SP500, these are the levels I would be looking at image
Liquidity - The solution to trading any market

- QTraders replied May 5, 2024
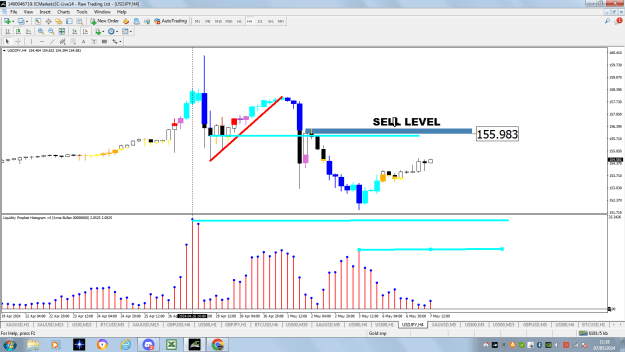
GBPUSD H4 Analysis 5.5.2024 The GBPUSD is looking to be sold I would imagine Monday or Tuesday 6-7th May 2024 image
Liquidity - The solution to trading any market

- QTraders replied May 5, 2024
GOLD ANALYSIS 5.5.2024 image No liquidity on the H4 chart so Gold is off the radar until liquidity picks up.
Liquidity - The solution to trading any market

- QTraders replied May 5, 2024
My Bitcoin analysis points to a further move up. the last time we hit the low level we rallied hard. I have two cycle points on the 13.5.2024 and the 17.5.2024 if we get to the top of the range on either of these two days I would look for shorting ...
Liquidity - The solution to trading any market
