- Search Forex Factory
- 166 Results
-
 Pipsalon replied Apr 7, 2017
Hello everyone, I took profit from this AUD/CAD short. Have a nice weekend!
Trading Institutional Order Flow


- Pipsalon replied Apr 1, 2017
Good morning everyone, I took profit from my GBP/USD long yesterday. Multiple targets were reached.
Trading Institutional Order Flow


- Pipsalon replied Mar 30, 2017
I took profit from 2 trades today. Short on Gold Long on GBP/JPY Still in a long trade on GBP/USD
Trading Institutional Order Flow


- Pipsalon replied Mar 29, 2017
I was long from this 4hr zone. The DXY lined up with it nicely.
Trading Institutional Order Flow


- Pipsalon replied Mar 29, 2017
Good afternoon everyone, 5 trades I took yesterday. 2 winners, take profits were at 3:1 2 Losers for 1R, makes it a total of +4R I had wins on AUD/CAD long and EUR/GBP short I had losses on EUR/NZD long and EUR/USD long I am still in a short on gold ...
Trading Institutional Order Flow


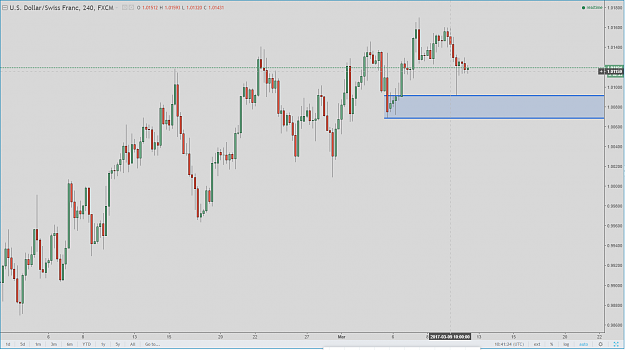
- Pipsalon replied Mar 10, 2017
USD/CHF is reacting of this 4hr demand zone. Which makes it not ideal to short at the 1hr SZ.
Trading Institutional Order Flow
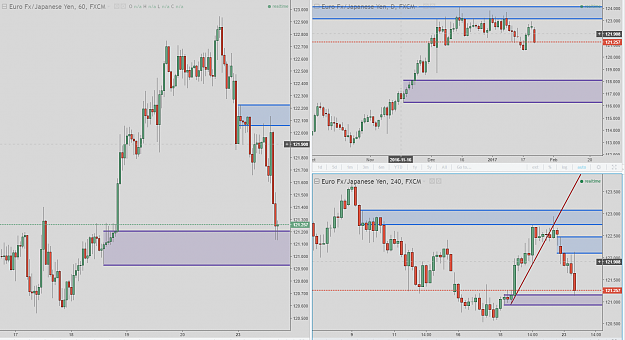
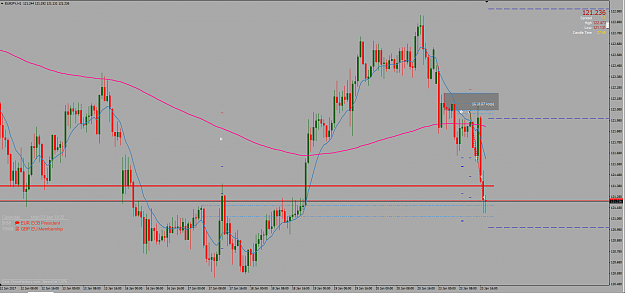
- Pipsalon replied Jan 23, 2017
I took this short trade today at EURJPY
Trading Institutional Order Flow
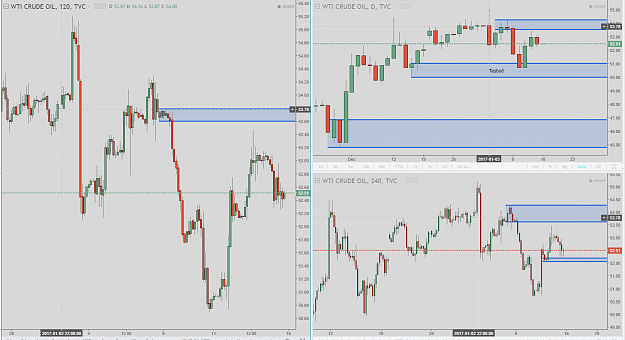
- Pipsalon replied Jan 15, 2017
USoil TDA. Daily/4h/2h Price is high on the daily curve. I start looking for sell opportunities. There is a 2h supply zone inside the daily SZ. The move away is good. There is a good profit margin for shorts, because demand zones below current price ...
Trading Institutional Order Flow
- Pipsalon replied Jan 7, 2017
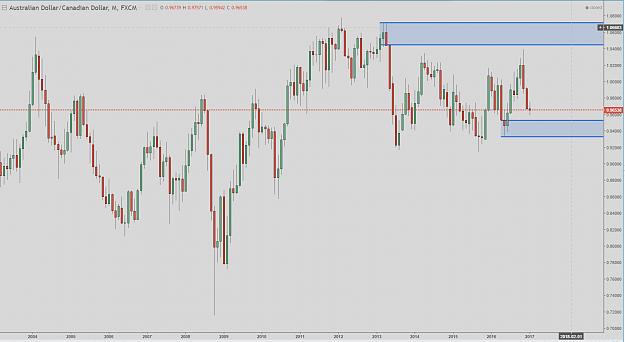
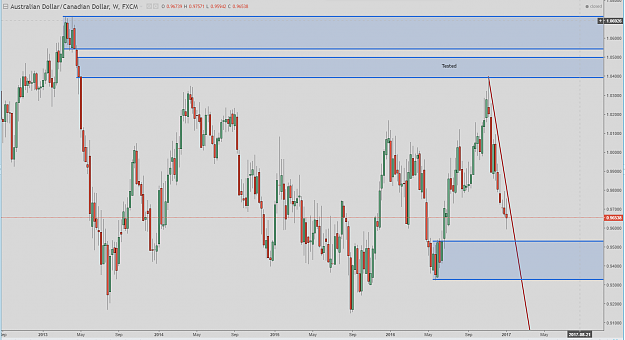
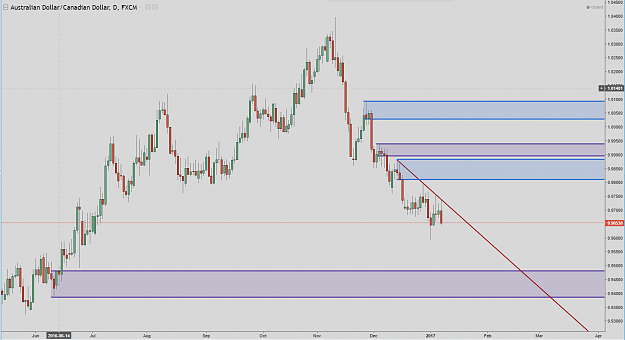
AUD/CAD TDA We are low on the monthly curve. If monthly demand gets reached and starts holding there is a lot of space to the upside. image The weekly is in a downtrend, momentum is down. I notice that there is nothing of quality supply formed on ...
Trading Institutional Order Flow
- Pipsalon replied Dec 21, 2016
Hello wm247, You are correct it is a potential DZ. Only the departure from the zone is not so good. The big green candle which left the zone has a small wick to the downside. This wick is pointing towards where the liquidity is. Which is in the zone ...
Trading Institutional Order Flow

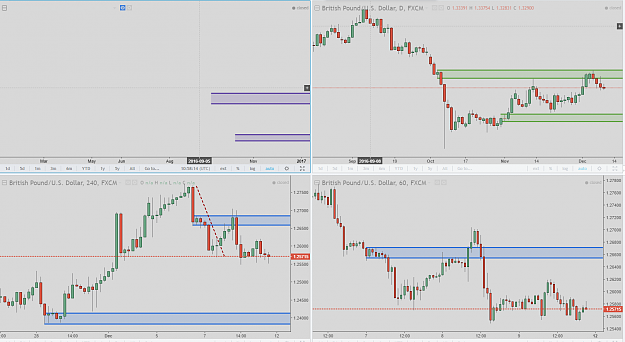
- Pipsalon replied Dec 14, 2016
Hello swTrue, The zone you marked as a DZ on your daily chart. I would not consider it as a demand zone, because of the big wick to the downside. The wick is getting liquidity from a lower zone. When you look at the 4hr chart you can see the 4hr ...
Trading Institutional Order Flow

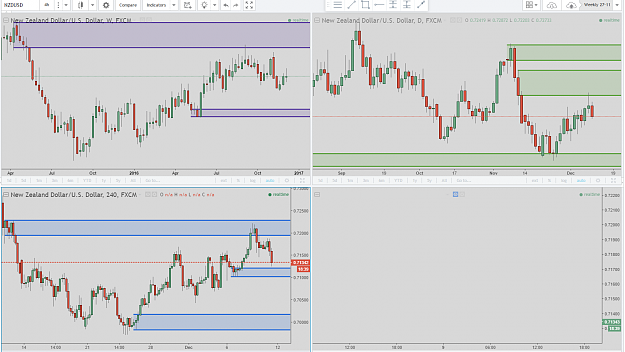
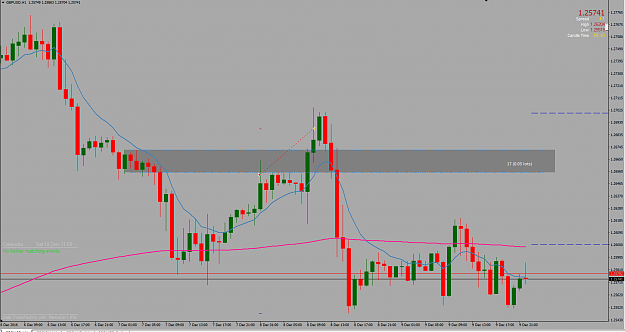
- Pipsalon replied Dec 10, 2016
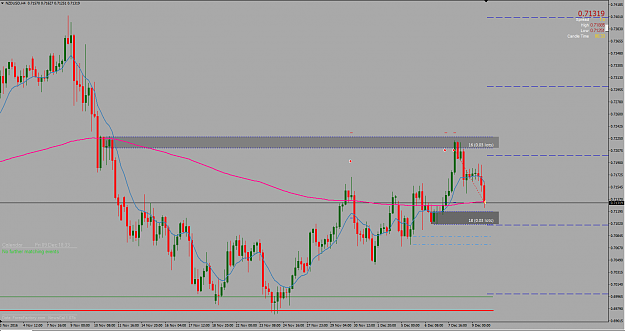
Hello everyone, This are 2 trade examples I took this week. 1 winner and 1 loser. Pairs: NZD/USD and GBP/USD
Trading Institutional Order Flow
- Pipsalon replied Nov 20, 2016
Does anyone here trade SILVER? Price is low at the weekly curve. I start looking for buy opportunties. image Daily: Price is at a RBR Demand zone, inside weekly demand. At this time I prefer to see a removal of daily supply first, before I go long. ...
Trading Institutional Order Flow


- Pipsalon replied Nov 20, 2016
NZD/CAD top down Weekly DZ has been broken by last weeks candle. There is room till the next fresh weekly demand zone. image Daily trend is down. Supply zones are being created and respected. The momentum is down as well. image I look for short ...
Trading Institutional Order Flow


- Pipsalon replied Nov 13, 2016
GBP/CAD Monthly perspective Price is inside monthly supply. I start looking for sell opportunities. image Weekly picture looks more or less the same. Trend is sideways. I have marked two RBD supply zones at the daily timeframe where I want to look ...
Trading Institutional Order Flow


- Pipsalon replied Nov 13, 2016
EUR/AUD Weekly: Price is in the middle of the curve. Price reacted of Weekly SZ during the US elections. Because of the big wick it is difficult to trade this pair for now. Most Euro pairs are having big wicks. For trades from a weekly curve ...
Trading Institutional Order Flow

- Pipsalon replied Nov 13, 2016
Good afternoon everyone, AUD/CAD Top down analysis. Weekly: Price reacted of weekly SZ. Weekly DZ is close now, so we are low on the curve. image Daily: Upside momentum has been broken on the daily timeframe, we are in a sideways market now. Daily ...
Trading Institutional Order Flow


- Pipsalon replied Oct 26, 2016
Good morning everyone USD/CHF Analysis. Monthly is high on the curve. I start looking for sell opportunities. image Price is inside weekly SZ. Momentum is up. Trend is still up. image On the daily there are still buyers close below price. I want ...
Trading Institutional Order Flow


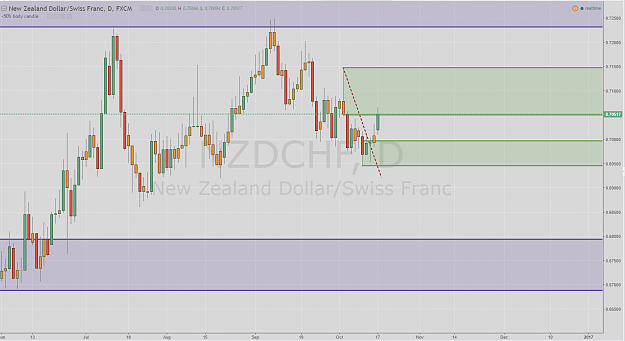
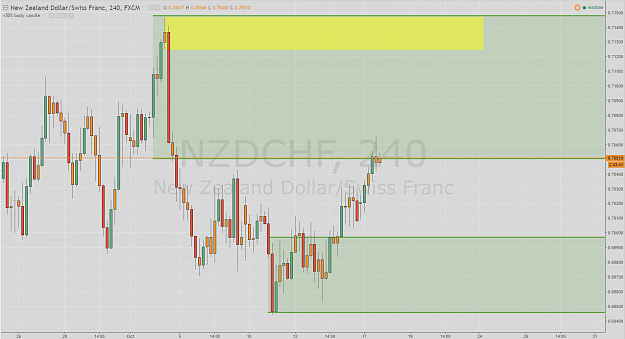
- Pipsalon replied Oct 17, 2016
Top down analysis Nzd/Chf. Weekly reacted of a SZ, second test into the zone. There is room to the next fresh weekly DZ. image Daily range is tight. Demand created by the break of momentum line. image If I look at my entry timeframe I find a 4hr ...
Trading Institutional Order Flow

- Pipsalon replied Oct 17, 2016
Hello hadi, This is my view on the EurUsd Daily. Price is inside a daily demand zone at the moment. The next fresh daily demand zone is much lower. There is room to supply above as well. Do not trade one single timeframe. This methodology is always ...
Trading Institutional Order Flow
