- Search Forex Factory
- 182 Results (1 Thread , 181 Replies )
- PandoraBox replied May 9, 2019
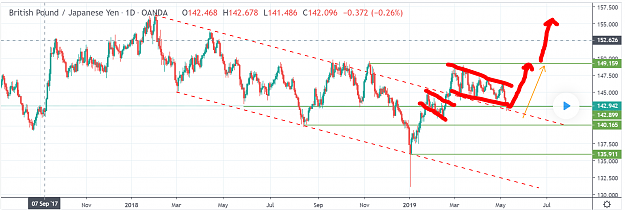
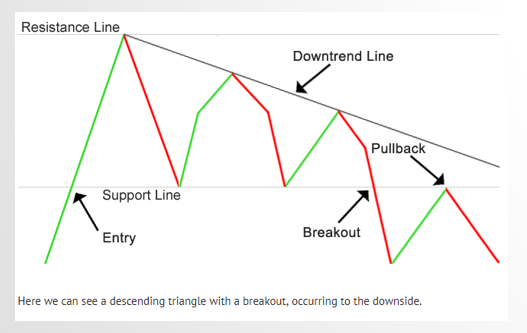
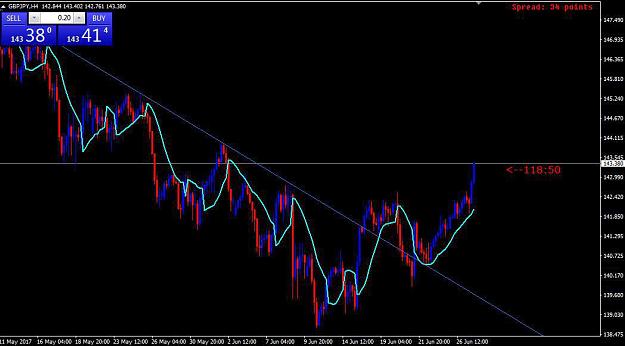
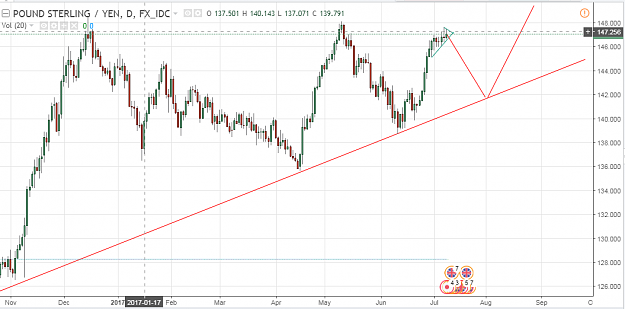
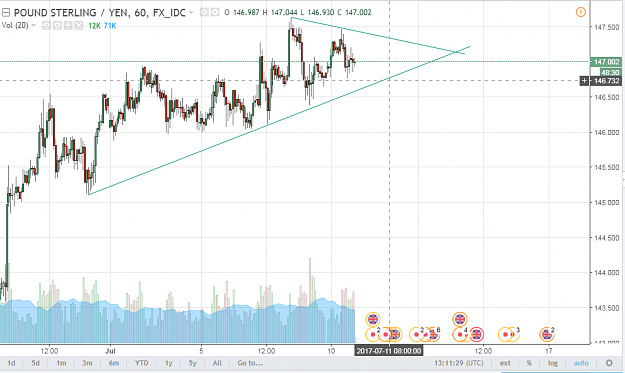
As I mentioned earlier, the pattern is Descending Triangle Pattern. Normally it will re-test or pullback to the previous support which now it become resistance. How strong it will be pullback I am not sure. You need to have order book indicator to ...
- PandoraBox replied Feb 25, 2018
2nd GJ Support at 147.200. We will see different market direction if GJ break this 2 support. Meanwhile, enjoy your holiday.
- PandoraBox replied Feb 25, 2018
GJ 1st Support at 147.700
- PandoraBox replied Feb 24, 2018
Make it simple. GJ have strong support at blue line.
- PandoraBox replied Feb 20, 2018
2nd - Target for swing trader.
- PandoraBox replied Feb 20, 2018
1st GJ pattern is confirm, ascending Triangle Pattern (Bullish).
- PandoraBox replied Feb 17, 2018
Step by step.
- PandoraBox replied Feb 17, 2018
Make it simple, for swing trader.
- PandoraBox replied Aug 2, 2017
Make it simple.
- PandoraBox replied Jul 28, 2017
image image
- PandoraBox replied Jul 13, 2017
Pictures will tell you everything.
- PandoraBox replied Jul 13, 2017
Bearish Flag
- PandoraBox replied Jul 11, 2017
Make it simple.
- PandoraBox replied Jul 11, 2017
GJ Current position.
- PandoraBox replied Jul 11, 2017
Finally GJ H1 TF break lower Trendline. GJ will re-test lower trendline, before continue drop.
- PandoraBox replied Jul 10, 2017
This is what I predict few weeks ago. When GJ hit 138.
- PandoraBox replied Jul 10, 2017
Bigger TF.
- PandoraBox replied Jul 10, 2017
Current Currency Meter, GBP weak.
- PandoraBox replied Jul 10, 2017
GJ H1, break lower trendline, GJ will DOOM! If break upper trendline, it will test 147.800.