- Search Forex Factory
- 682 Results
-
 medici replied Mar 16, 2024
NQ at critical point, it would seem.
Islander and Medici trade the European open
- medici replied Mar 12, 2024
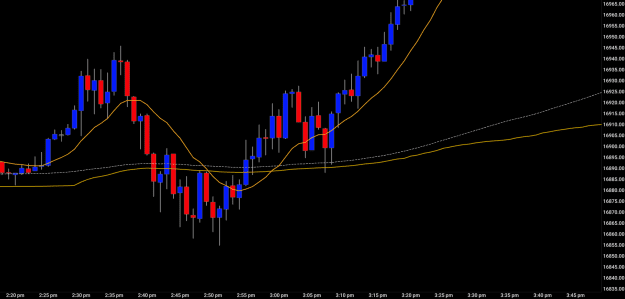
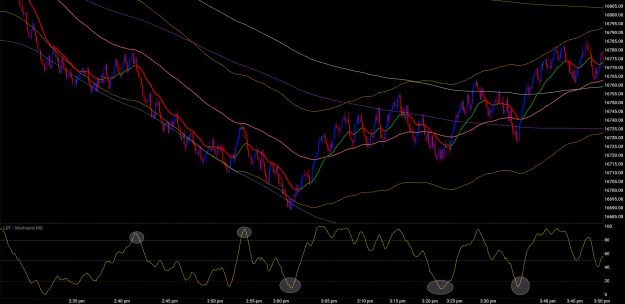
On Tradovate I really like this version of CCi, with settings 25 and 13. It's a 700 tick chart.
Make Trading simple!
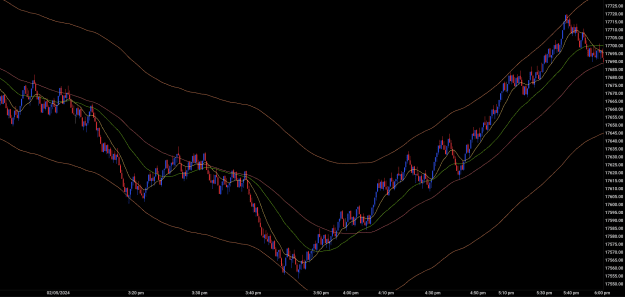
- medici replied Feb 6, 2024
Or range bar charts, if you like.
Islander and Medici trade the European open
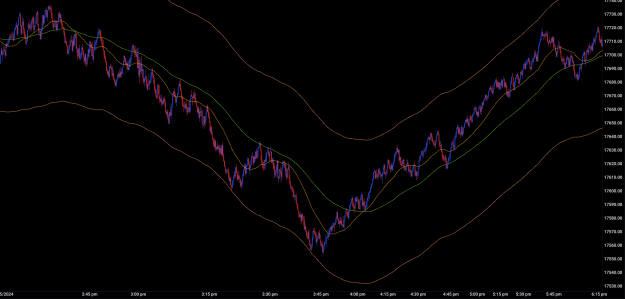
- medici replied Feb 6, 2024
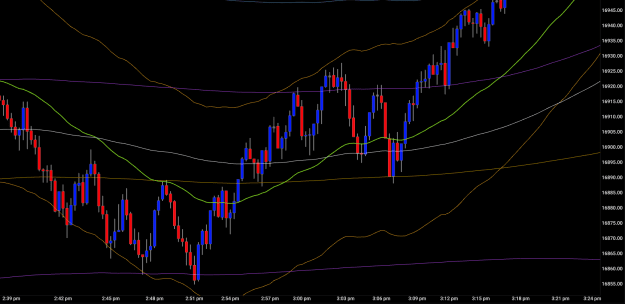
Which of course is smoother with tick charts
Islander and Medici trade the European open Here WMA150/0.30% and WMA55 on a 700 tick chart,
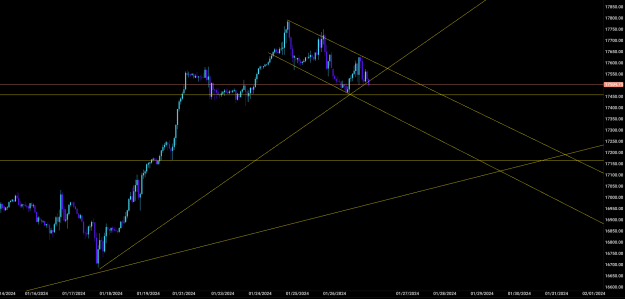
- medici replied Jan 28, 2024
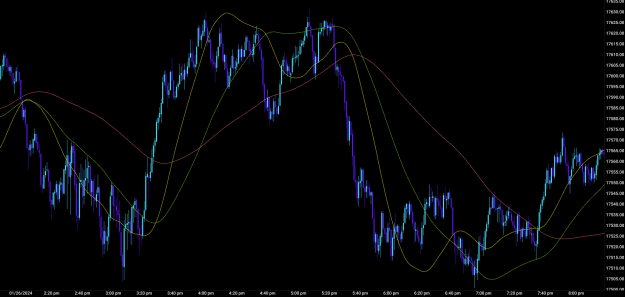
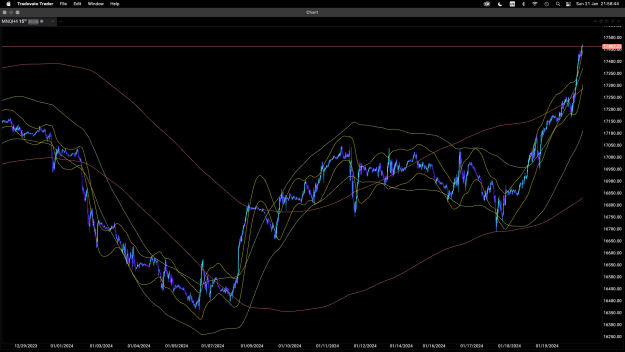
And the nearer term view of the coming week, with FOMC statement on Wednesday, on the hourly chart.
Islander and Medici trade the European open
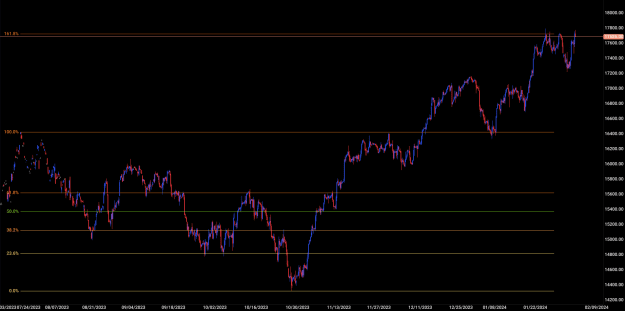
- medici replied Jan 28, 2024
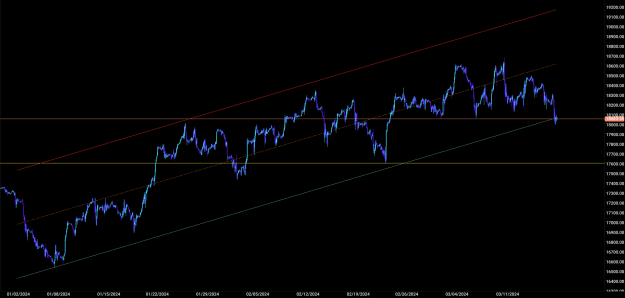
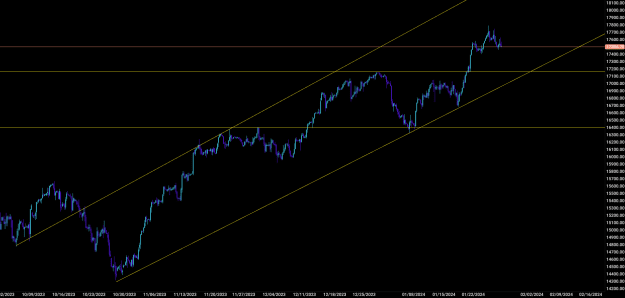
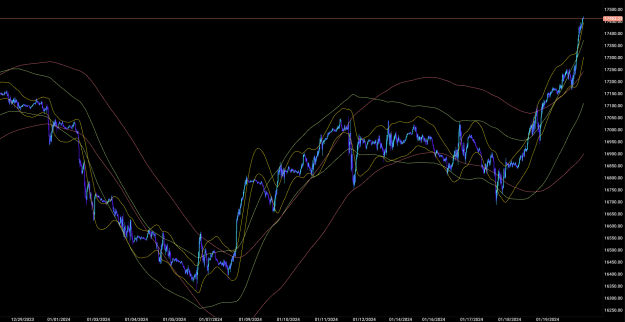
And here's the big picture (4h chart) in the Nasdaq index.
Islander and Medici trade the European open
- medici replied Jan 28, 2024
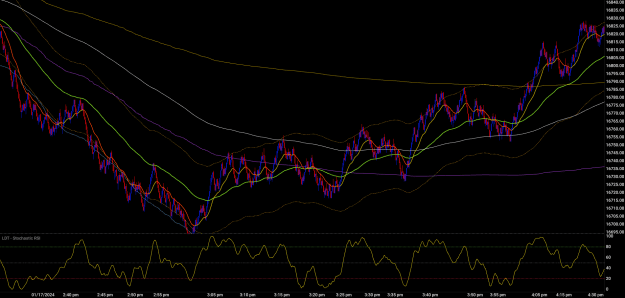
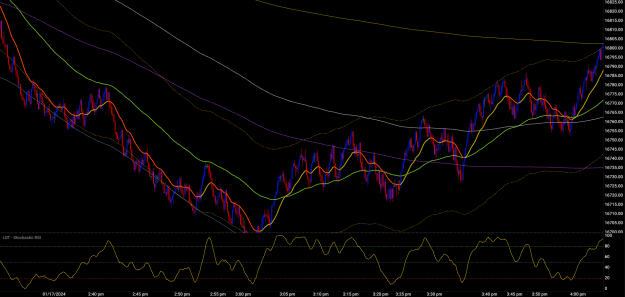
Another interesting week in the markets
Islander and Medici trade the European open during which my development time has gone to the Hull Moving Average. The HMA is interesting because it isn't as lagging as other moving averages, and it is less whipsaw prone. Mathematically it's ...
- medici replied Jan 24, 2024
I agree. Too much stuff on the chart, and I find it hard to make decisions. So I've been attempting to declutter my charts this week. One radical version, which I like, is to trade with just the VWAP bands and a Hull Keltner channel. On the 700 tick ...
Islander and Medici trade the European open
- medici replied Jan 22, 2024
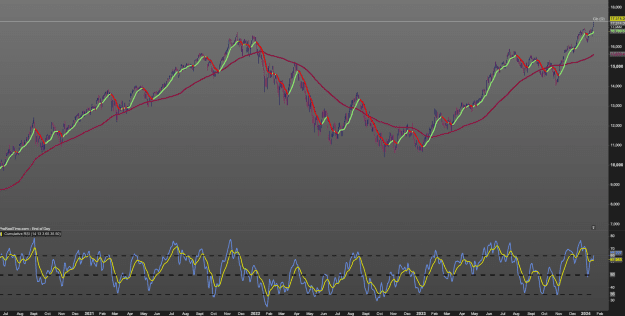
Merci Alain, that is very elegant. For the daily I've found a simple setup that works for me - 100 day VWAP/VWMA (around which a 5 day Keltner channel can helpful), WMA17, and Cumulative RSI. Which shows me divergence in the RSI at a rather elevated ...
Islander and Medici trade the European open
- medici replied Jan 21, 2024
For comparison: two versions, differing in the red envelope only.
Islander and Medici trade the European open
- medici replied Jan 21, 2024
A multi-scale review of the week in NQ in three overlapping pictures. I've taken a renewed interest in multi-scale envelope forecasting, about which I posted in the thread run by Islander and me. Cross-posted here, should anyone be interested. These ...
Analysis and Trading based on Envelopes, Waves, Cycles


- medici replied Jan 21, 2024
A multi-scale review of the week in three overlapping pictures. What a week it was, and I am happy with my catch for the week, but I also felt that I was too focused on the scalping perspective when big moves were underway. For the purpose of ...
Islander and Medici trade the European open

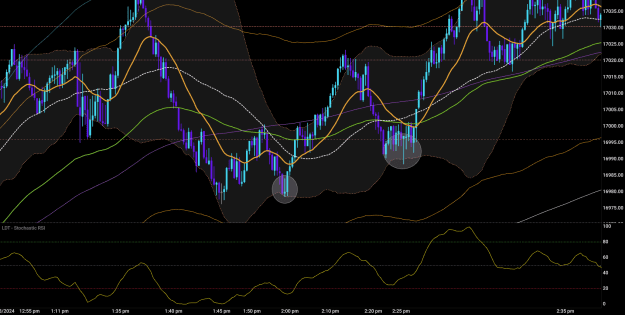
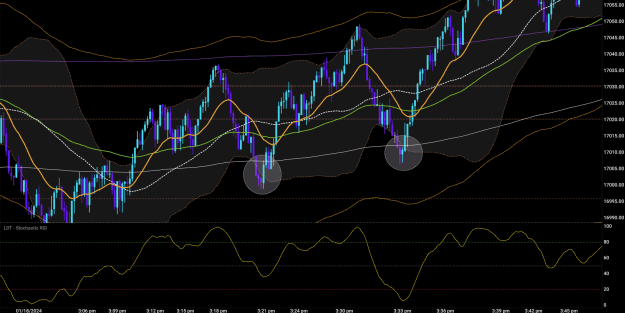
- medici replied Jan 19, 2024
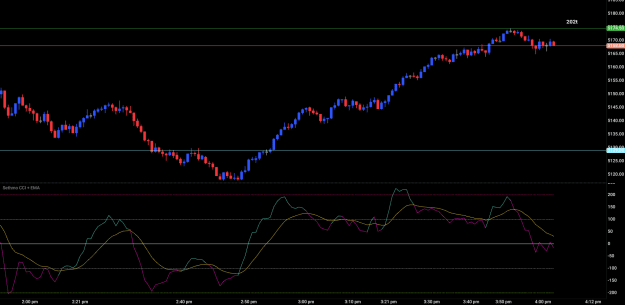
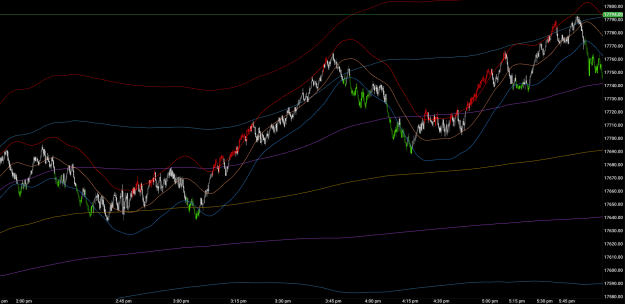
The BB would work as an OB/OS indicator, but one would have to find the entry trigger by separate means. Perfectly viable as a strategy to only trade setups supported by this indication. A couple of examples from yesterday afternoon attached. With ...
Islander and Medici trade the European open
- medici replied Jan 19, 2024
Btw, an alternate way to play the tick chart is to use a slightly slower SMA instead of the fast EMA, and to use the corresponding Bollinger bands instead of an oscillator. On my 700 tick chart it would be with period 40, so perhaps 35 on your ...
Islander and Medici trade the European open
- medici replied Jan 19, 2024
I usually take a look at the 30m chart to see what's going on. Opened above VWAP as you say, and with trend up that was likely to continue, but being more that half a percent from EMA20@1h something had to give. As things seem to be run, the change ...
Islander and Medici trade the European open
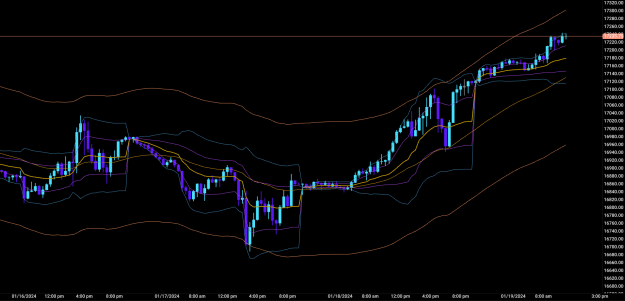
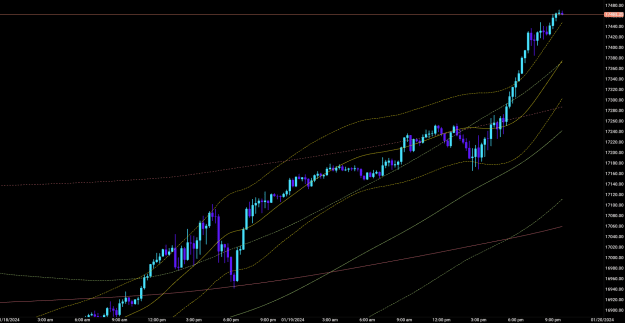
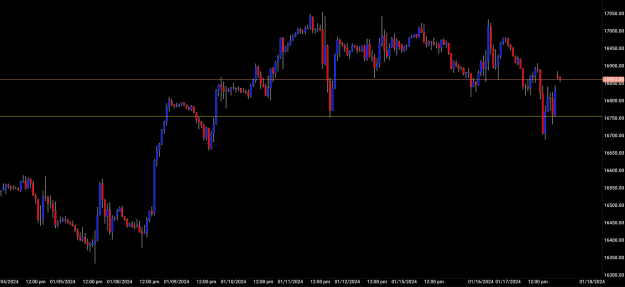
- medici replied Jan 18, 2024
With such as measly afternoon, I stayed on for the evening session and a 135 point ride up to a new high. It will probably continue, but enough for today.
Islander and Medici trade the European open
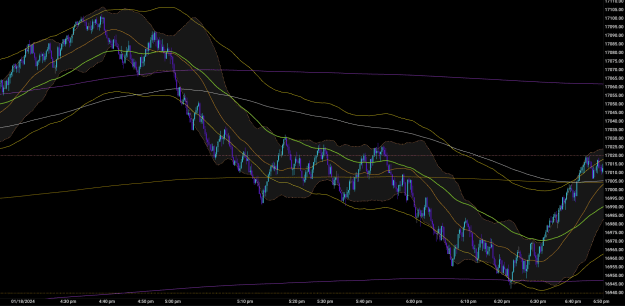
- medici replied Jan 18, 2024
If anyone is curious about tick charts but lack the broker support for that, one may try range candles instead. Here's first an 18 tick range bar chart, then a 700 tick tick chart. Same chart settings otherwise.
Islander and Medici trade the European open
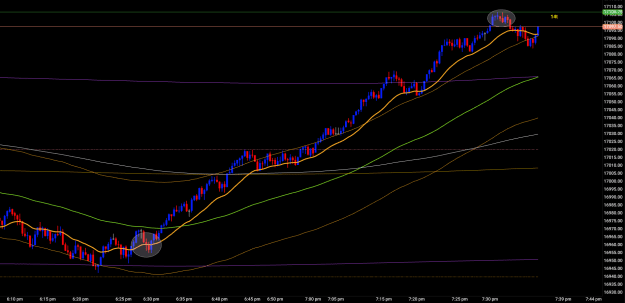
- medici replied Jan 17, 2024
Break before rally - that's what I thought too, but I didn't have the patience to hang on until the rally which didn't start until 7pm UK time. This was a break below an obvious level for market makers to get some juicy liquidity from stops to buy ...
Islander and Medici trade the European open
- medici replied Jan 16, 2024
Islander may have other things to say about this, but to me it's good to have a couple more indicators on the chart for big picture. Such as EMA200 and daily VWAP. With that you would have seen what was going on, and where to place your stop. Makes ...
Islander and Medici trade the European open