- Search Forex Factory
- 88 Results
-
 Trotty replied Dec 4, 2013
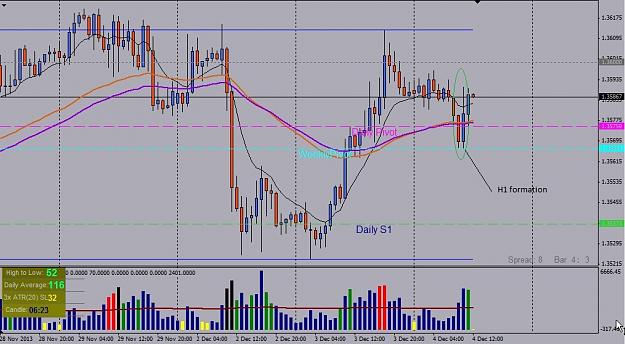
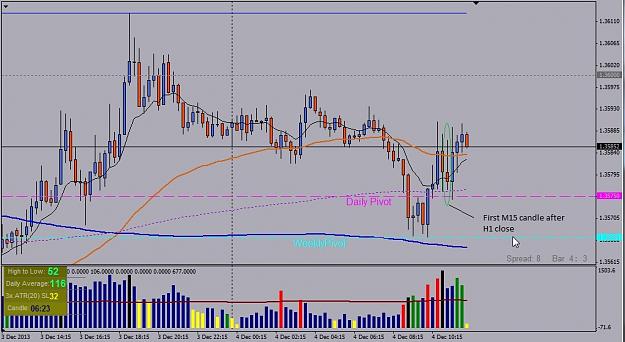
I was PMd by Forex Force who asked one or two questions about using higher timeframes to help with the M15 entries. I talked about some ways in which they help paint the path into entries it's hard to explain without charts. I said i'd put a chart ...
Trade what you see NOT what you expect
- Trotty replied May 25, 2012
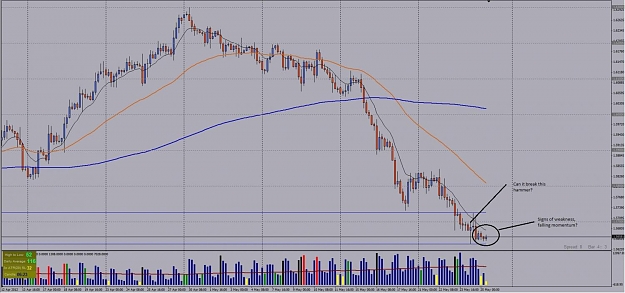
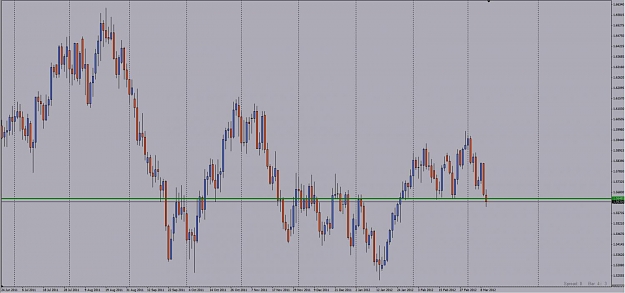
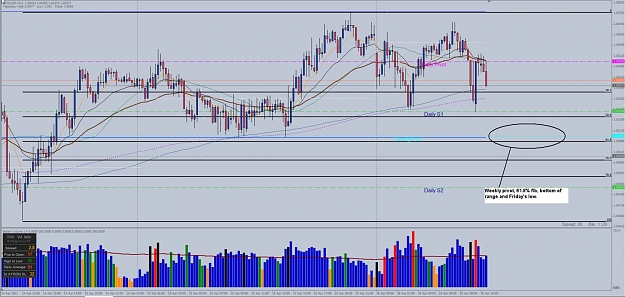
One of them chart thingys.... — Cable is now at a key area. After a parabolic move back to this level, it's now at a pretty significant area of prior support (best seen on the daily chart). If you view the weekly, you'd expect it to carry on ...
Trade what you see NOT what you expect
- Trotty replied Mar 27, 2012
AU — Multiple touched line, just drill down to a lower TF and look for an entry signal. I got it on M5 using VSA, you could get it other ways. I would rarely want to take a pure touch on a line like this, it's just an srea of interest, that's ...
Trade what you see NOT what you expect
- Trotty replied Mar 22, 2012
tHat setup on EU — Sure Kodziro would explain this a helluva lot better than me. You can look at this similarly to a mini version of a H+S the same sort of principles apply. So the background is important. Ideally, you need a sharp move ...
Trade what you see NOT what you expect
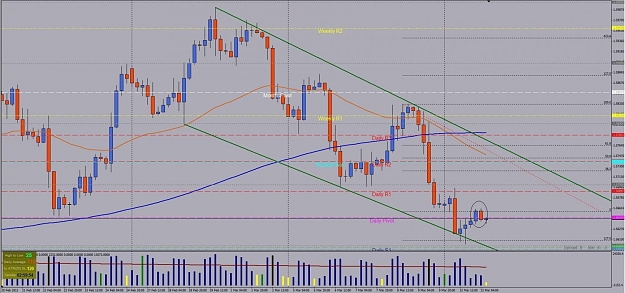
- Trotty replied Mar 20, 2012
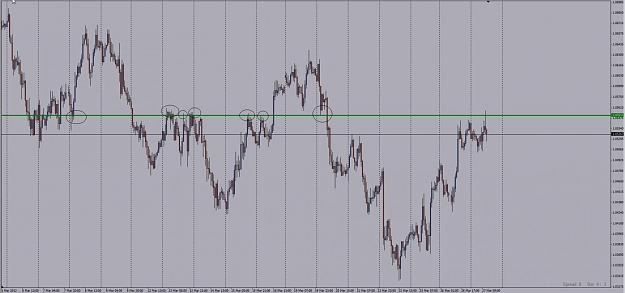
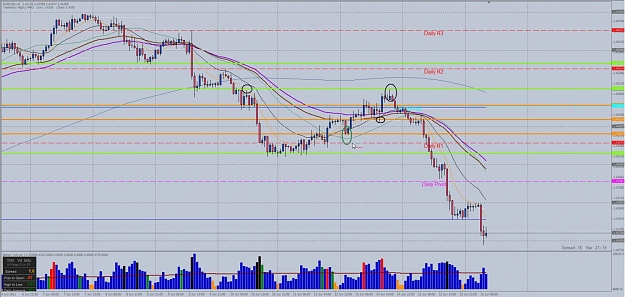
Monring all. Watch area on GU. PPA line, bottom of chanel, 61.8% fib retracement, supply, monthly pivot etc etc
Trade what you see NOT what you expect
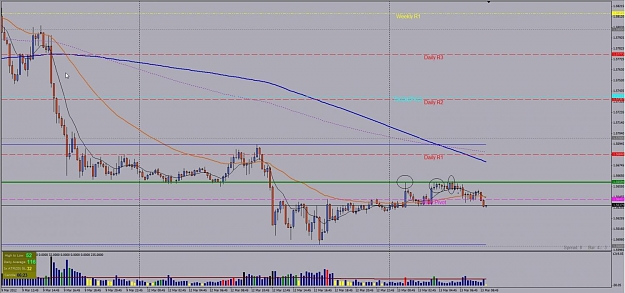
- Trotty replied Mar 16, 2012
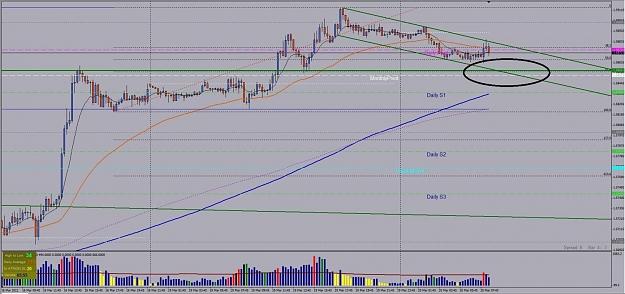
Taking a breather at this shallow trendline right now
Trade what you see NOT what you expect
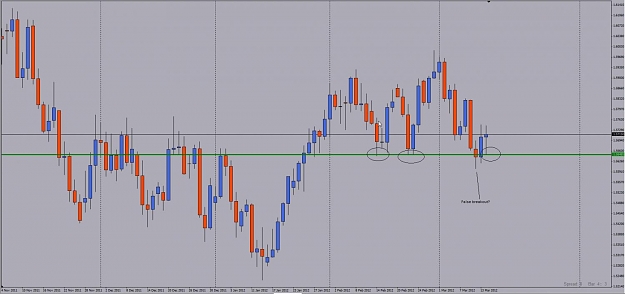
- Trotty replied Mar 14, 2012
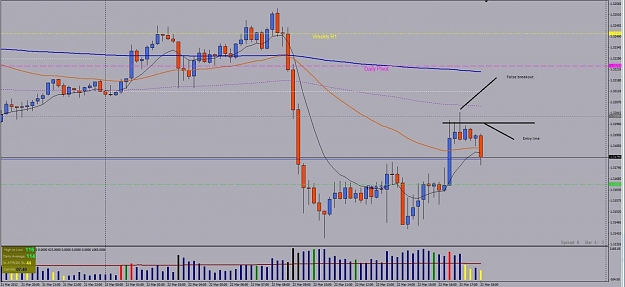
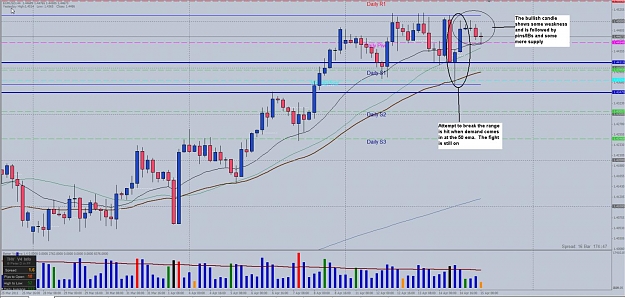
Daily view on GU — Something to note here. Yesterday's daily close was bullish after Monday's close was weak and scarcely below our ppa line. This looks a little like a false breakout/rejection off that level for now. Today, we have come down ...
Trade what you see NOT what you expect
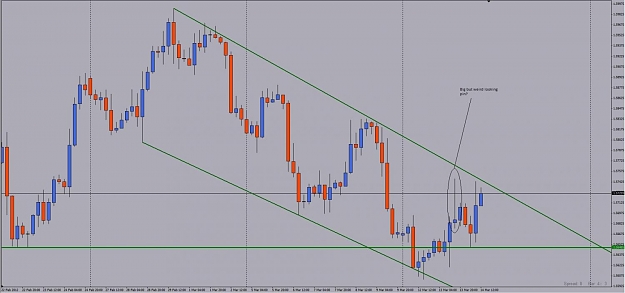
- Trotty replied Mar 13, 2012
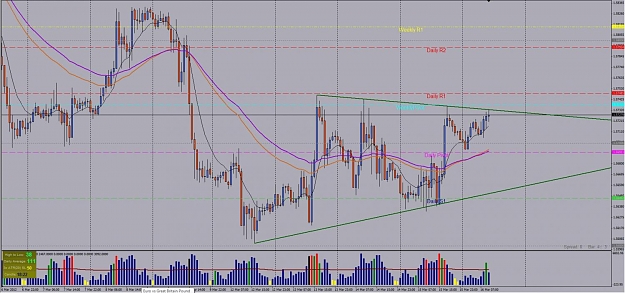
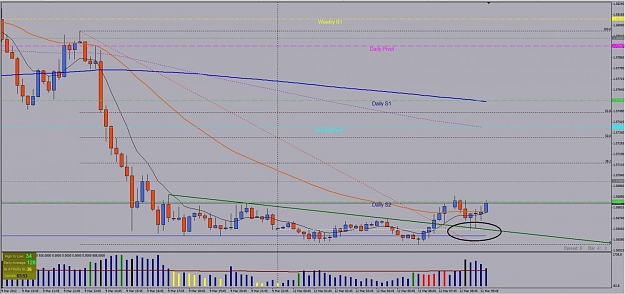
4 hr view GU — Very shallow retracement so far suggests more downside. Circle is tweezer tops on my 4hr. EO/Infinity do define this as a DBHLC but for me, it need to close below the close of the prev candle for that to be valid. Not strong ...
Trade what you see NOT what you expect
- Trotty replied Mar 13, 2012
We did eventually but early this morning. I was happily zedding away but you could have traded this in any one of a few ways. If you see that asia low from yesterday, it's am area that had a good few bounces before it eventually broke. This sort of ...
Trade what you see NOT what you expect
- Trotty replied Mar 12, 2012
Don't get me wrong, I wouldn't want to have much of a long position right now. This is a bear market. Look at friday's close on the daily charts, tells you all we need to know. Big bearish engulfing candle and a long, big bearish close. A decent ...
Trade what you see NOT what you expect
- Trotty replied Mar 12, 2012
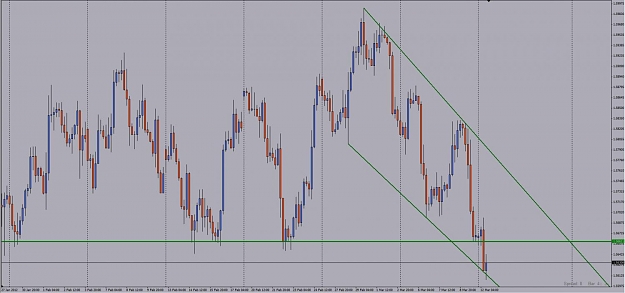
Just a little something to add to your 4 hr view mate. We are testing the bottom trendline here as well as a fib extension. That green line is worth watching for any longs though but the break of support has not been that decisive yet.
Trade what you see NOT what you expect
- Trotty replied Mar 12, 2012
A chart! — Ok, so this is exactly the sort of entry that EO would take if he saw it. It has little to do with the MAs but many of the setups talked about in these pages were just that. The overall background of the market is fairly bearish ...
Trade what you see NOT what you expect
- Trotty replied Feb 22, 2012
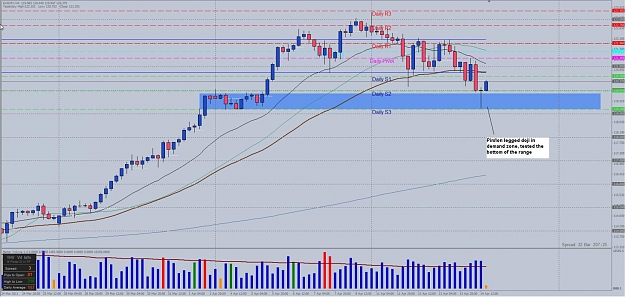
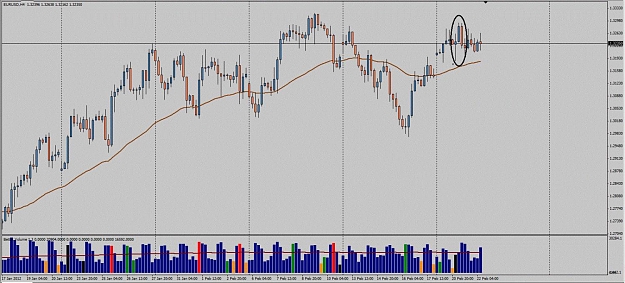
Just my take — I always look at the recent candle patterns to help guide my overall bias. Here (circled) I see a hammer from which, into the uptrend, should entice demand. Buyers do pile in on the next H4 candle which closes bullish but then ...
EURUSD
- Trotty replied Jun 16, 2011
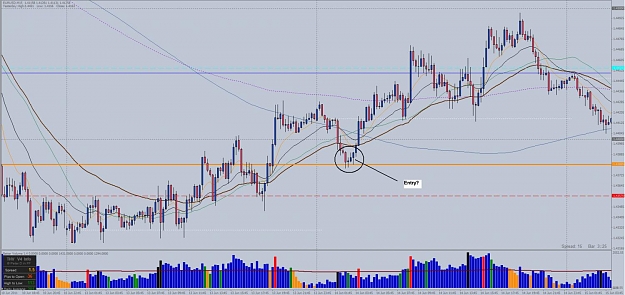
Sorry it took me a while to respond, not been trading too much recently. There are dozens of ways you can trade breakouts. Some better methods than others but none of the are necessarily the right way. Here is the way I trade them and it's served me ...
Trade what you see NOT what you expect
- Trotty replied May 20, 2011
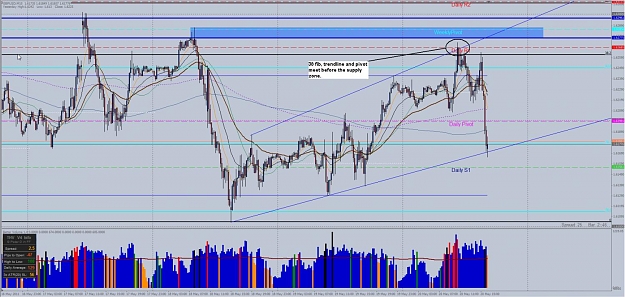
Chart — Just a quick example of what i'm blathering on about, from today. I would want to draw my supply area off the wick on this example due to the wick being fairly large. However, you have this very nice confluence point just 9 pips ...
Ken's Continuing Successes with EO's system
- Trotty replied Apr 18, 2011
I'd have drawn it more like that because the sharp drop didn't begin until the small bearish candles took us away from the bottom of that consolidation.
Ken's Continuing Successes with EO's system
- Trotty replied Apr 18, 2011
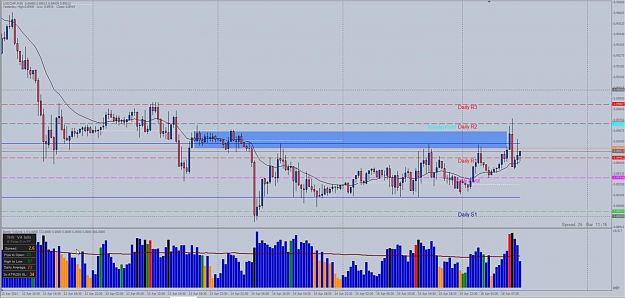
AU area — Hello all. Just an area to watch on AU, I like the look of this as either a scalping opportunity or turning point. The fib level is one from a few potential fibs you could draw on the up swing, not the strongest as a result of that ...
Trade what you see NOT what you expect
- Trotty replied Apr 15, 2011
EU is is an interesting spot here. I threw the chart up yesterday with the tripple top and bearish engulfing. Can we still play off that? Look what's happened since. I'm always wary about betting against the trend but this trend is finally showing ...
Trade what you see NOT what you expect
- Trotty replied Apr 14, 2011
Anyone catch the long off that pin on H4, EJ? Was a fraction slow, might look for a pullback to go long.
Trade what you see NOT what you expect