- Search Forex Factory
- 809 Results (5 Threads , 804 Replies )
-
 ha-pattern replied Aug 30, 2015
Okay, I got a little something. While rl is basically a way of measuring the y axis on a trading chart, I found in stock trading, when all those financial symbols in the early 2000's went south, that a triangle is a common chart shape for such ...
Pattern's Chemo-Electric Trading Journal
- ha-pattern replied Aug 29, 2015
I've made no progress in even pretending to trade; however, since still redoing my own ptm ( -- denoted as "ToM model, which I now realize is only the early-age version and people, later on, come up with their own thinking model that includes it ...
Pattern's Chemo-Electric Trading Journal
- ha-pattern replied Jun 7, 2015
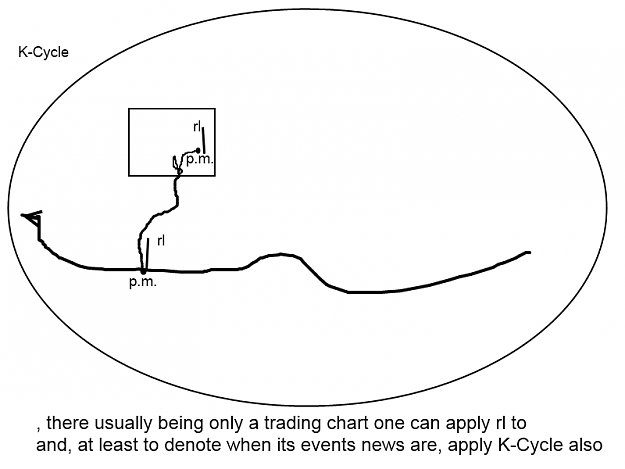
P.m. for squiggly lines, since it's based on a dot/position-point being, in some way, what that squiggly line bounces off / works with / etc. rl for flat lines, since it's based on levels being, in some way, what that flat line bounces off / works ...
Pattern's Chemo-Electric Trading Journal
- ha-pattern replied May 13, 2015
Another trading method (practice once, only done in practice -- as always (in last 5y) : From what I read, energy = potential energy + kinetic energy. I don't claim to know much about what this means, but I'm trying a trading method off it. ...
Pattern's Chemo-Electric Trading Journal
- ha-pattern replied May 8, 2015
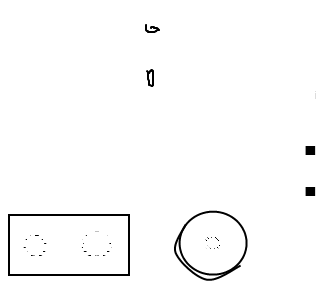
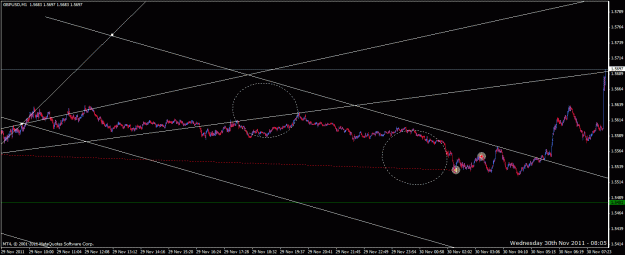
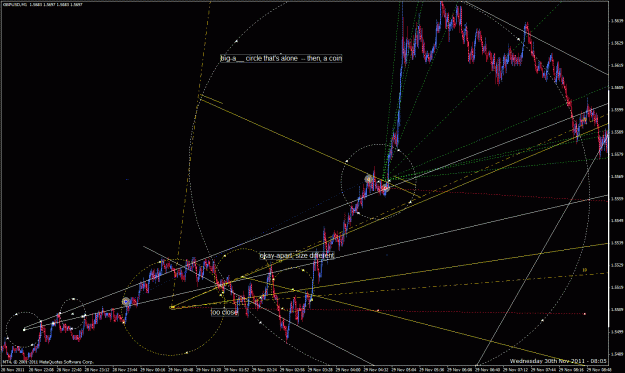
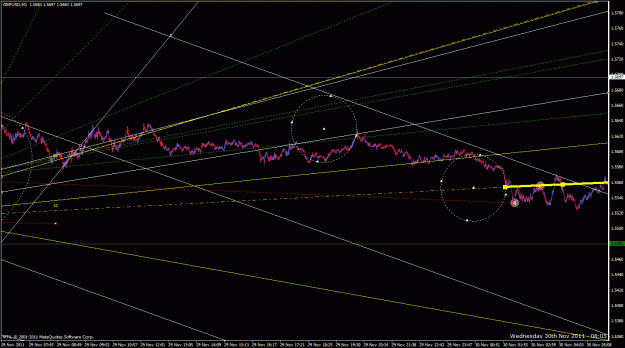
What do I do? I stick a dollar bill on it, and see if anything goes near it. Oh, it doesn't have to be a dollar bill -- any country's is fine. -- That's my new trading method. - - - - The idea is, there's two circles on a dollar bill, and a coin is ...
Pattern's Chemo-Electric Trading Journal
- ha-pattern replied Apr 22, 2015
I made a bit more progress. This time, the charting method -- still in practice mode -- is about combining my coded-pattern sense of space (p.m. (part of my own ptm)) and time (roller language) as the respective predominant, infinite axis. Regular ...
Pattern's Chemo-Electric Trading Journal
- ha-pattern replied Apr 16, 2015
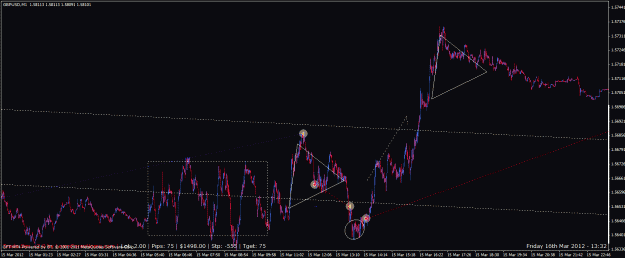
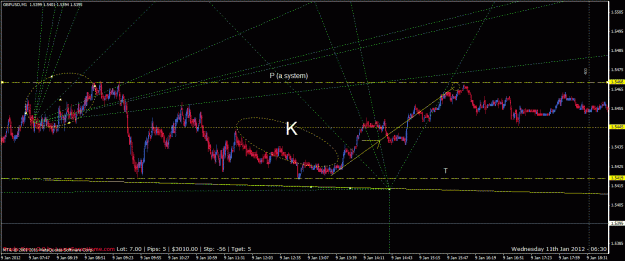
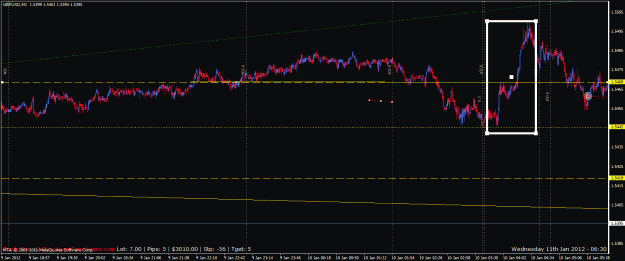
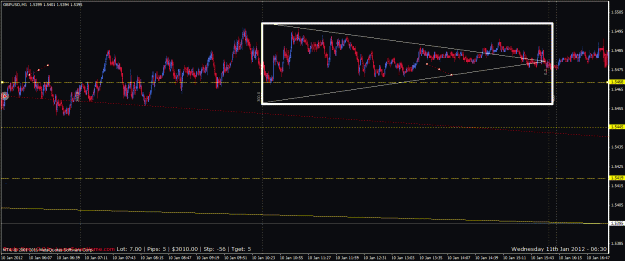
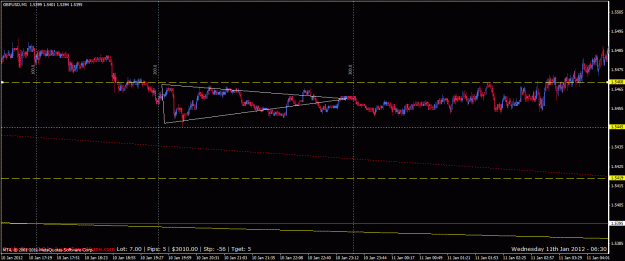
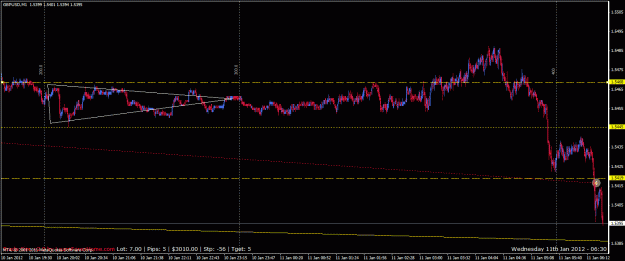
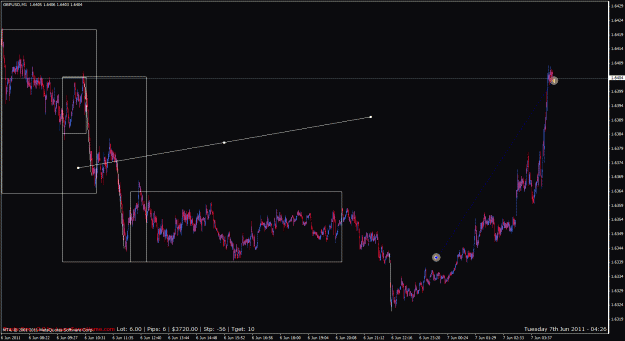
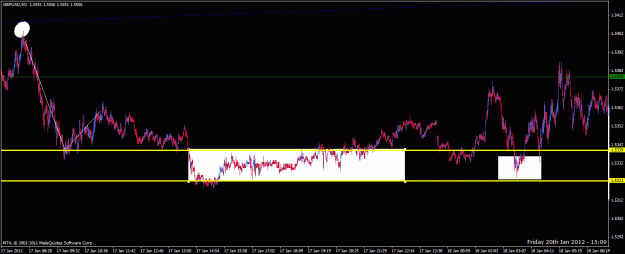
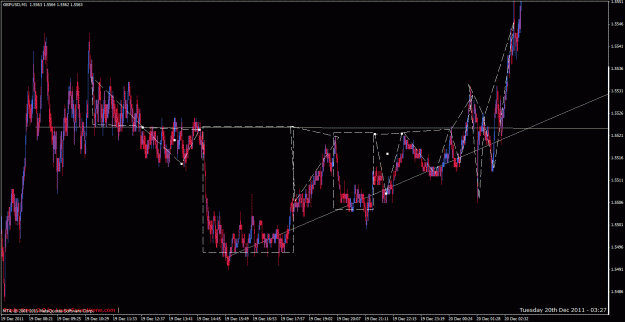
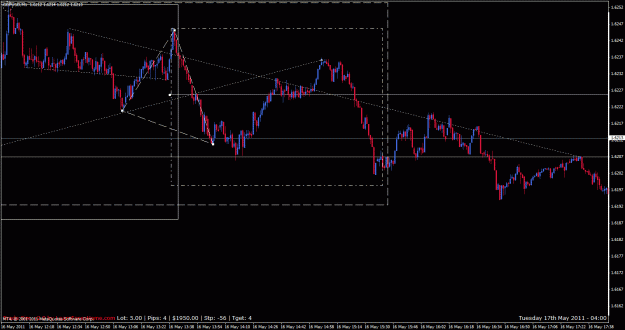
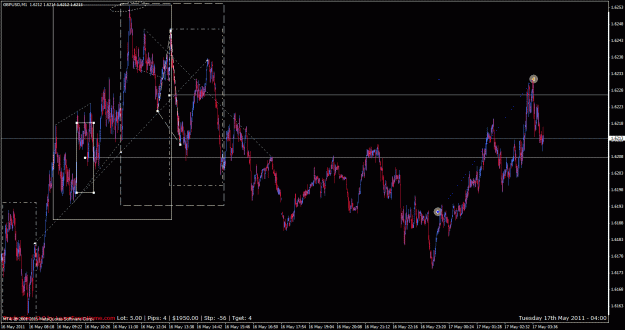
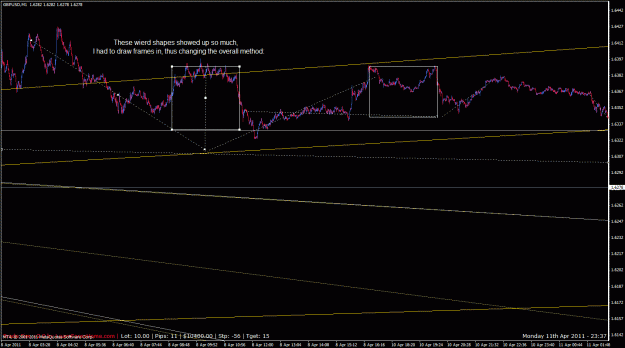
This one below, the second chart picture, was so off-key that it had a sort of intrinsic balance all by itself. And when the second pattern set in the same chart picture was, too, only in a different way, I decided to go with the midline of the ...
Pattern's Chemo-Electric Trading Journal
- ha-pattern replied Apr 16, 2015
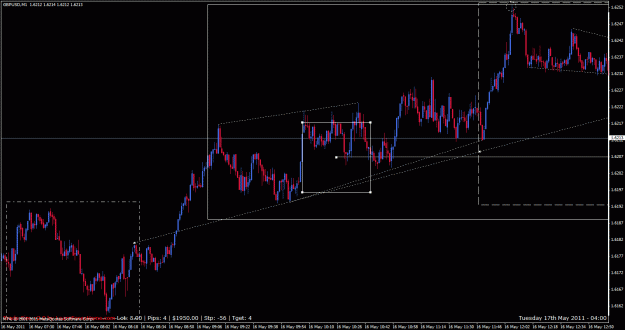
opp-balance method -- renamed: drawing over appropriate sets of candles (near-)vertical line segments, noting/avoiding less-straight ones finding patterns that repeat and thus balance with each other, and considering how they balance with each other ...
Pattern's Chemo-Electric Trading Journal
- ha-pattern replied Apr 16, 2015
Hi, Yaed ! If I can figure a reasonable answer for you, I'll give it a try. -------------------------------------------------------------------------------- Separate from and ignorant of the post above, I wrote another new (practice) trading method. ...
Pattern's Chemo-Electric Trading Journal
- ha-pattern replied Apr 8, 2015
Radically changed my method again, so forgot the last post's lesson; I'll include it in the next practice trade. In this next method, I really did simplify the technicals -- although the option to complicate them is, still open. I use a grid -- ...
Pattern's Chemo-Electric Trading Journal
- ha-pattern replied Apr 4, 2015
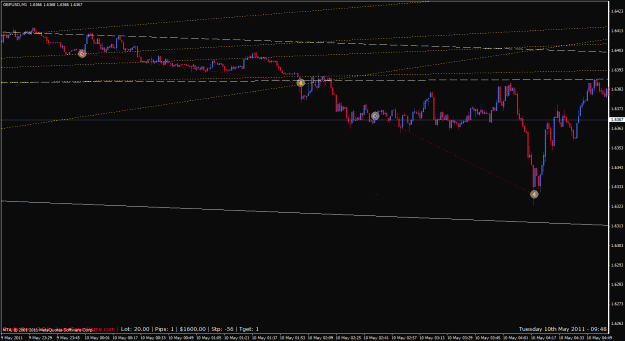
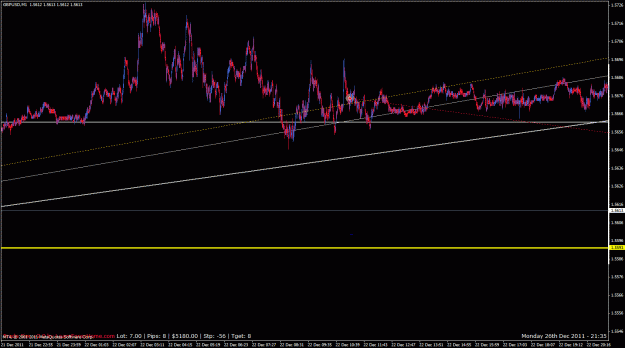
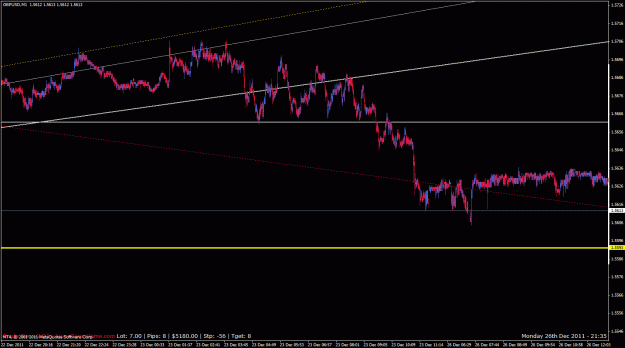
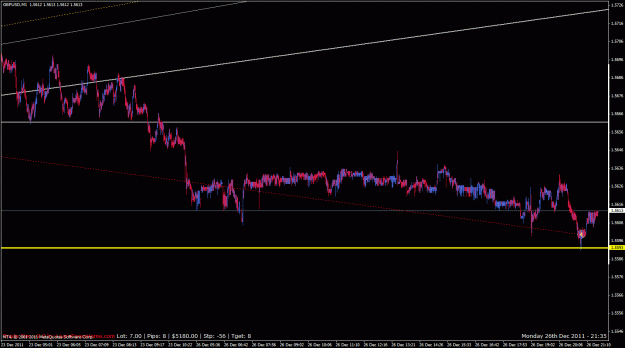
Some graphing type of submethod to match the trade-management part of the method: image image image image image image image image image image
Pattern's Chemo-Electric Trading Journal
- ha-pattern replied Apr 3, 2015
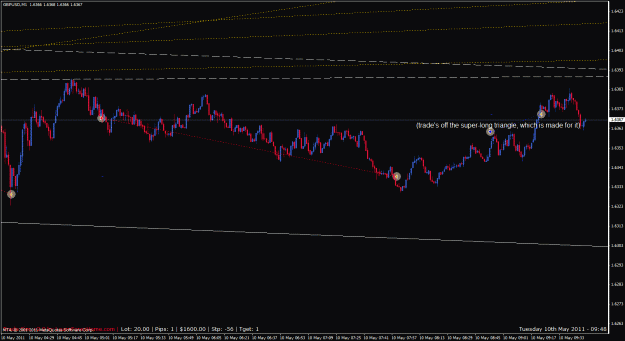
Finally, I got another chart-trading method worth anything. I can't say so beyond a single practice trade, but at least it's something: image image I'll try to explain it in time; it's very simple, but untested. ---- Okay, I tested it again, and ...
Pattern's Chemo-Electric Trading Journal
- ha-pattern replied Mar 19, 2015
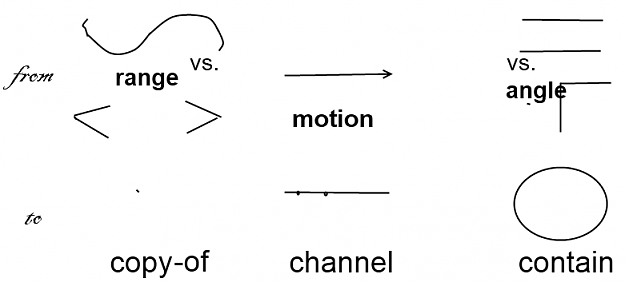
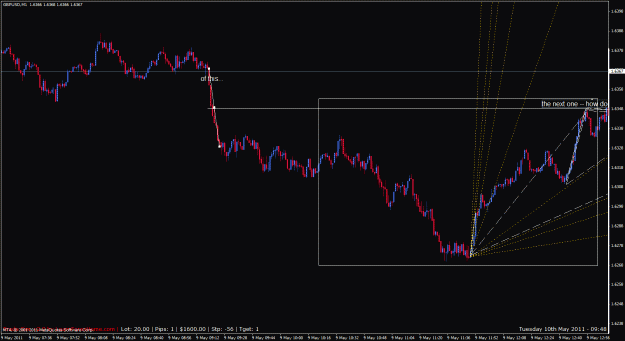
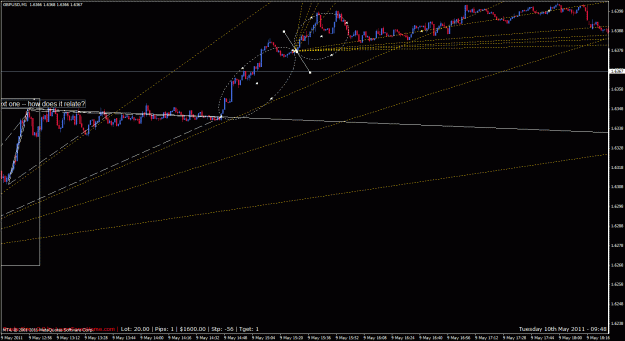
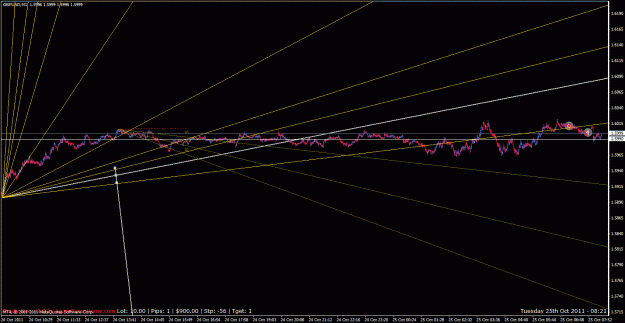
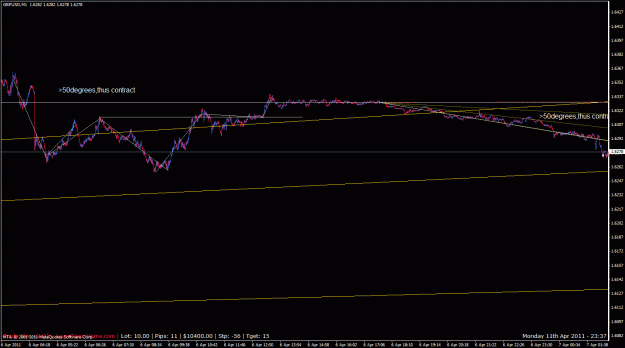
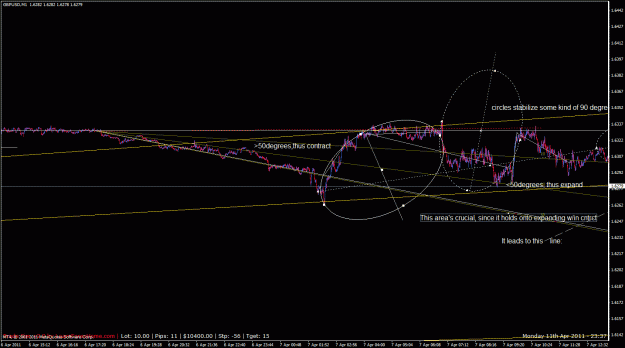
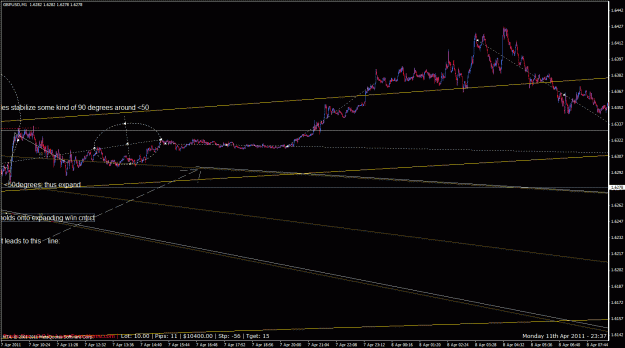
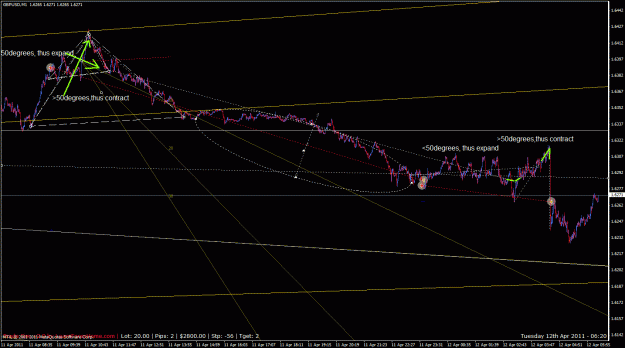
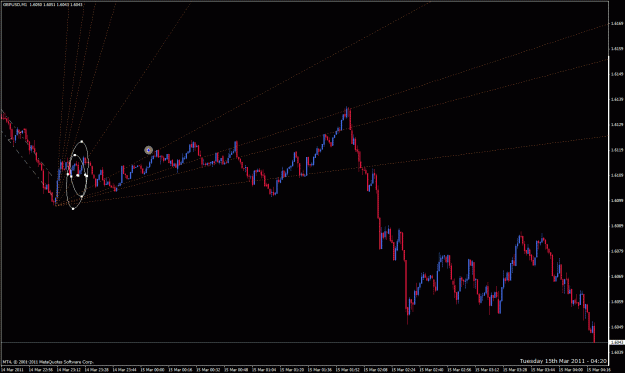
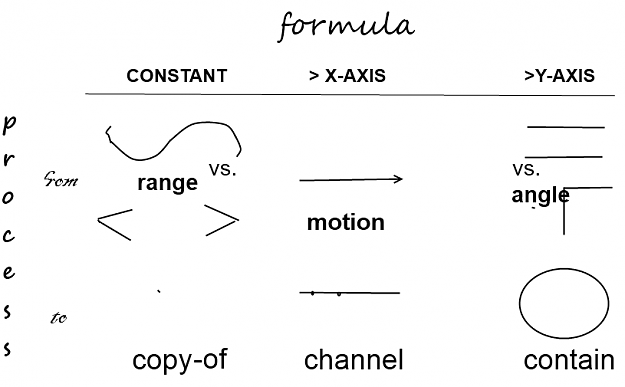
Okay, that method -- ----------------------------------------------------------------------------------------------------- " angle Most people deal with optical illusions right on the chart. Thus, I figure it'd be a good idea to apply them to ...
Pattern's Chemo-Electric Trading Journal
- ha-pattern replied Mar 16, 2015
Okay, in this use of the angle method, at least it's more clear that the only difference between uses/examples now is that going up and down is the implier of said difference -- thus, different shapes applied to the screen, while cleanly staying ...
Pattern's Chemo-Electric Trading Journal
- ha-pattern replied Mar 16, 2015
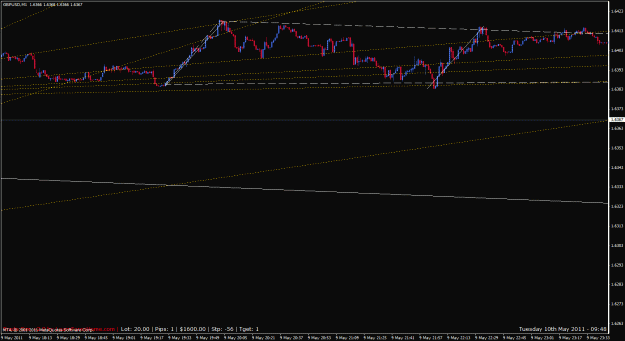
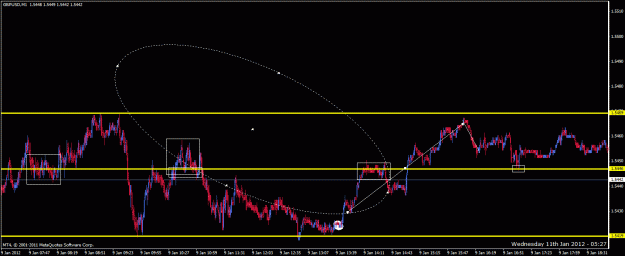
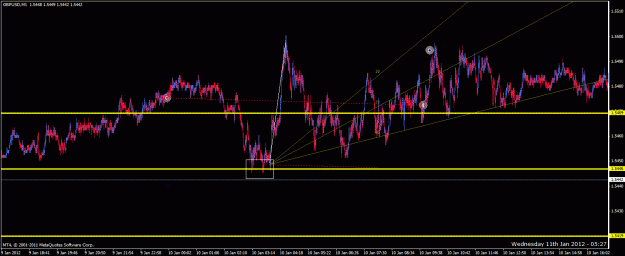
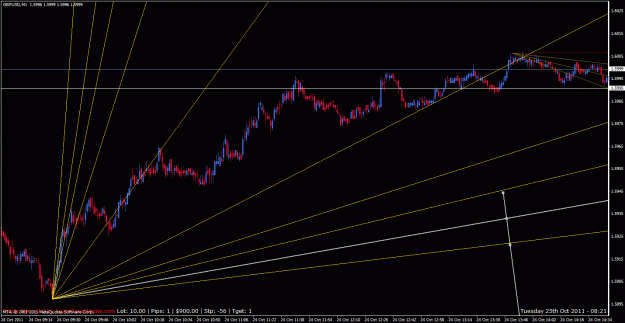
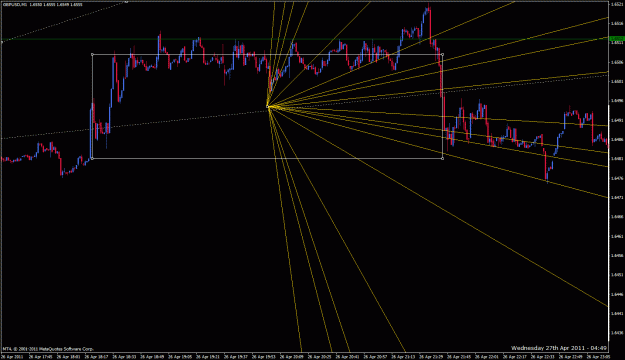
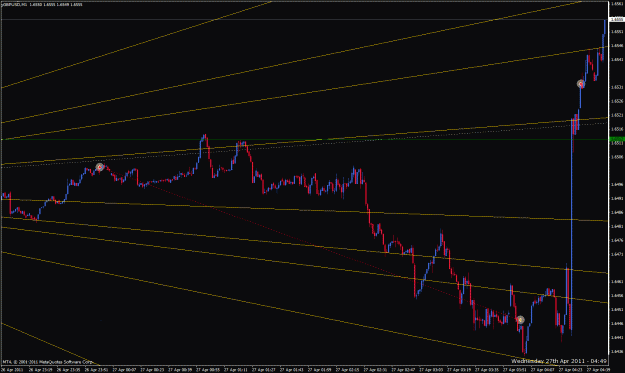
Renamed method as "angle", since that's the anchor of it. An example of it that's fairly stable and representative, if not extensive: image image image image image
Pattern's Chemo-Electric Trading Journal
- ha-pattern replied Mar 14, 2015
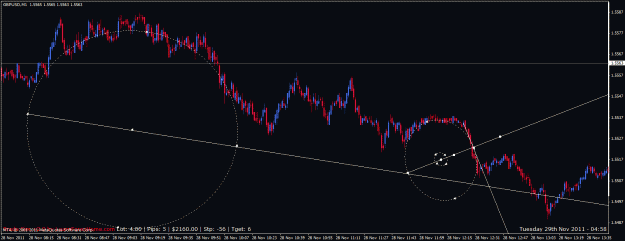
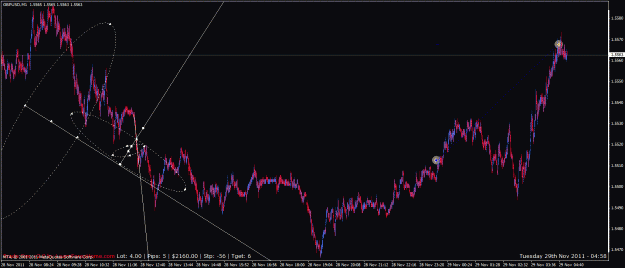
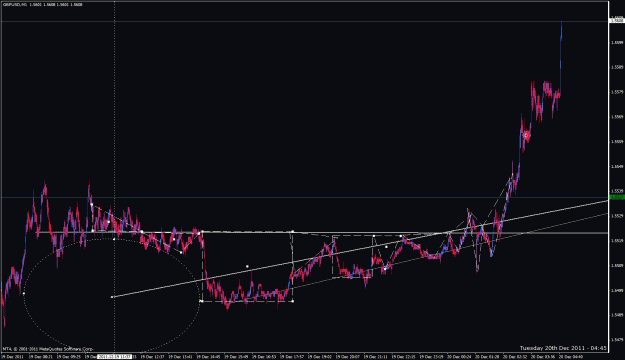
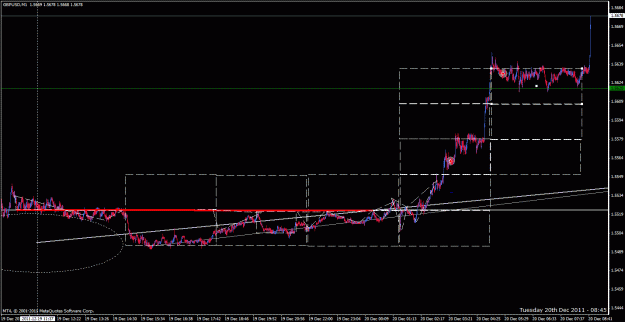
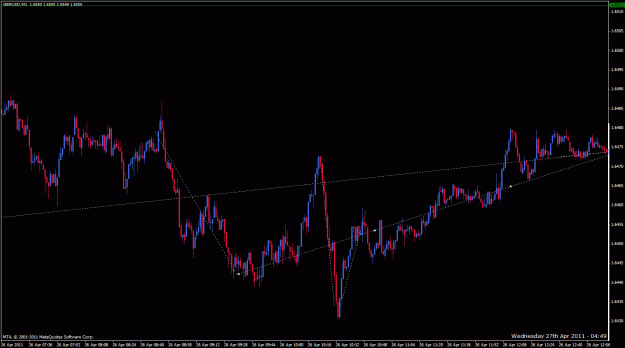
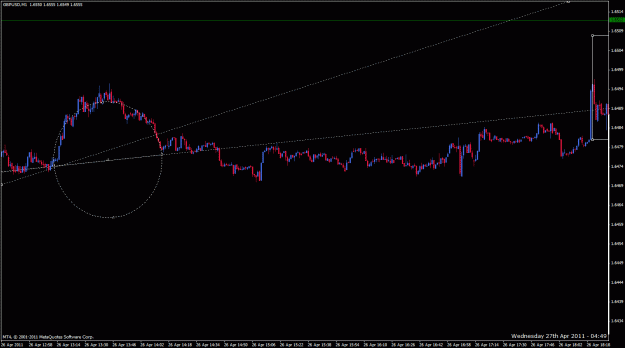
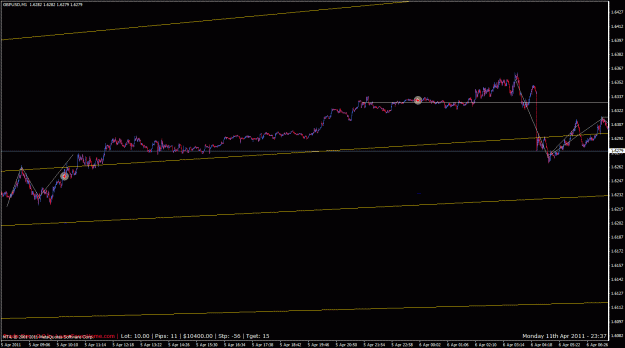
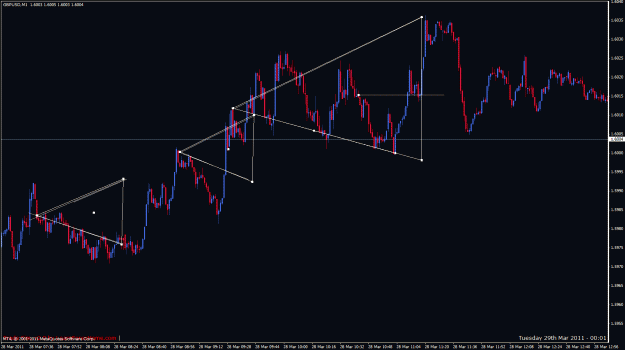
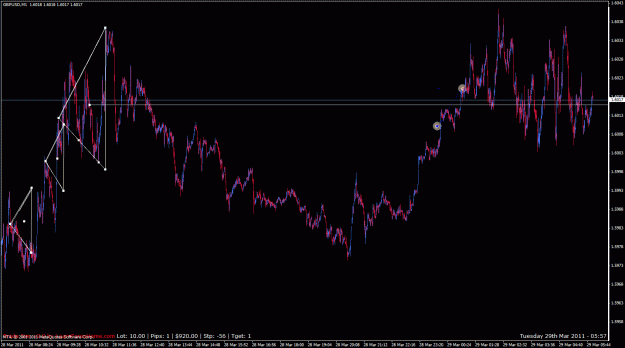
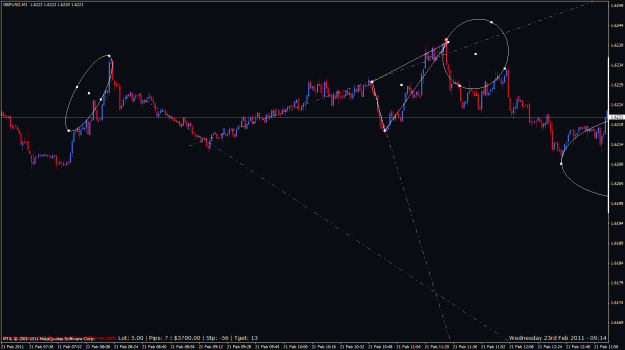
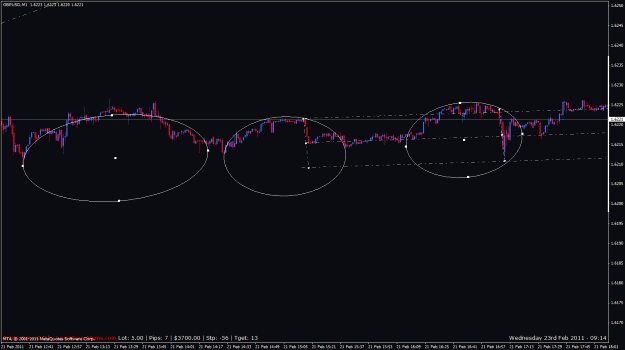
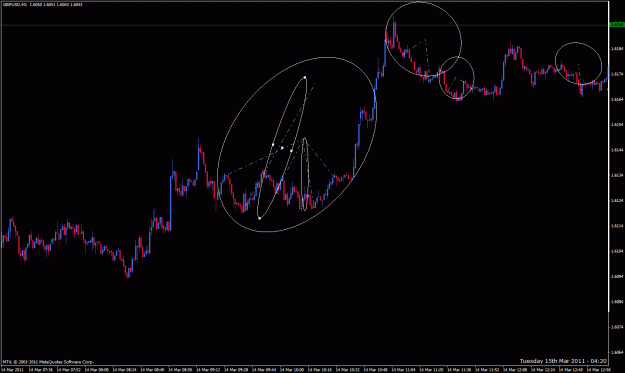
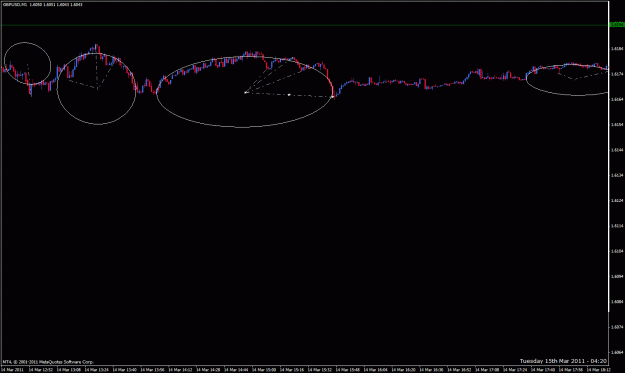
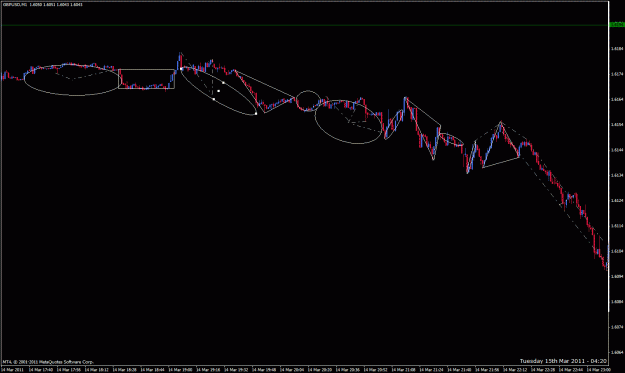
The method needed some additions, such as whatever big-bunch-of-lines built-in patterns may fit in, and a genuine purpose for circles. Circle have infinite number of radiuses, so when they're showing a perfectly-balanced-within set of candles, ...
Pattern's Chemo-Electric Trading Journal

- ha-pattern replied Mar 13, 2015
Most people deal with optical illusions right on the chart. Thus, I figure it'd be a good idea to apply them to putting patterns on charts to read them for a trade A rule from here (pg. 1) states that "This apparent expansion of the acute angle ...
Pattern's Chemo-Electric Trading Journal
- ha-pattern replied Mar 12, 2015
Hey, yaed! Thanks for contributing. "systematics" sounds a good one, I'd certainly like to achieve that one. Also, thanks for inspiring me in your last post here. -------------------------------------------------------- Well, that -- this last ...
Pattern's Chemo-Electric Trading Journal
- ha-pattern replied Mar 11, 2015
Though it was nice dealing with less, the figuring drawn picture was a little rough. Here's a substitute (and thus the redo for post#1): ------------------------- " ...
Pattern's Chemo-Electric Trading Journal
- ha-pattern replied Mar 10, 2015
Alright, I'm dumping the method. It's all explanatory and ordered, but it doesn't get to the point of it. So I'm moving on to an apparently-simpler method -- and, I'll include the seminal part of the last method. ---------------------- Perspective ...
Pattern's Chemo-Electric Trading Journal