- Search Forex Factory
- 11 Results

- liquidmoment replied Sep 21, 2009
Looks like a bullish gartley could be forming on the 4 hr chart. I reckon we could test 1.6360 MM area then continue in its southward trend to 1.5970 where their is some strong yearly support. May all your pips be
Cable Update (GBPUSD)
- liquidmoment replied Aug 19, 2009
You could be right there bud,we had a Doji on the last candle on GBP 1 hr chart.
Cable Update (GBPUSD)
- liquidmoment replied Aug 13, 2009
Here's what I see , Possible breakout of lower channel in process. Long @ 1.66069 Take Profit 1 @ 1.67117 Take profit 2 @ 1.68091 S/L 1.65597 May all your pips be
Cable Update (GBPUSD)
- liquidmoment replied Jul 31, 2009
Here's what I see . A close above 1.6584 and we could test 1.6746 area by early next week. A close below 1.6475 would make 1.6360 a realistic target. May all your pips be +
Cable Update (GBPUSD)
- liquidmoment replied Jul 28, 2009
Seems like a beautiful H@S pattern forming on 1 HR chart . 1.6390 (1/8th MM ) level could be a realistic target during NY session. I'm waiting on a close below the 1.6447 before I dive. May all your pips be +
Cable Update (GBPUSD)
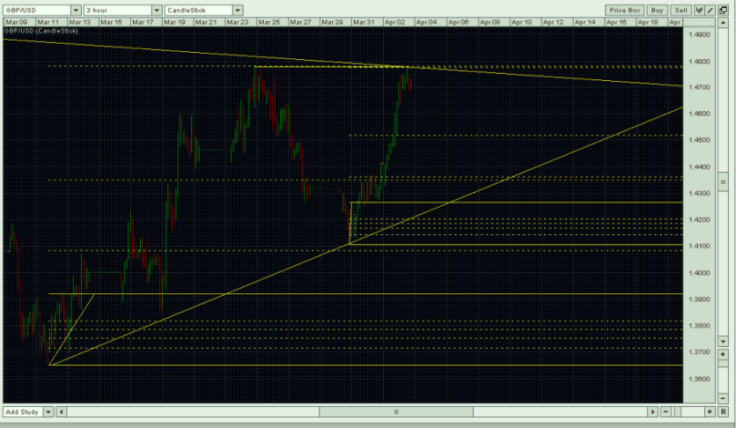
- liquidmoment replied Apr 3, 2009
Looks like Major resistance @ 47714 according to my charts. I see a possible retracement back to around the 45188 Fib level from 30th march low .
Cable Update (GBPUSD)
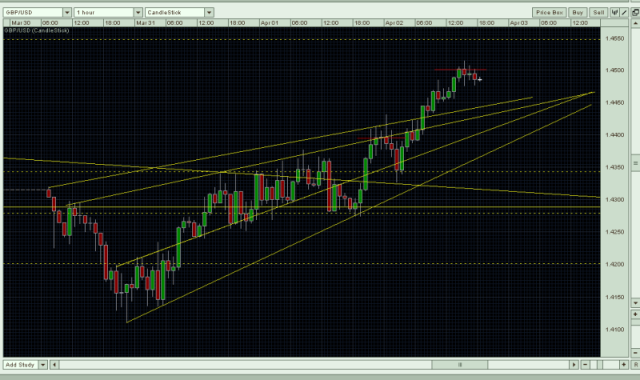
- liquidmoment replied Apr 2, 2009
Just noticed what looks like a possible H & S forming on the 1 HR chart . Anyone else see this ?
Cable Update (GBPUSD)
- Posts by Member Search: 'liquidmoment'