- Search Forex Factory
- 46 Results
-
 dfumagalli replied Dec 19, 2014
CFDs are usually managed by brokers as Market Maker. Thus the CFD liquidity is only "internal" to them. Most brokers have very few customers trading on any but the most famous (i.e. S&P 500, DAX and similar) securities, you should not trade CFD with ...
Beyond the Candles
- dfumagalli replied Dec 3, 2014
Trendlines provide informations, not confirmations. Even when you get a strong confluence, you have to pull the trigger (set up an order) based on confirmations, informations just reinforce confirmations and give you feedback on the quality of your ...
Beyond the Candles
- dfumagalli replied Sep 16, 2014
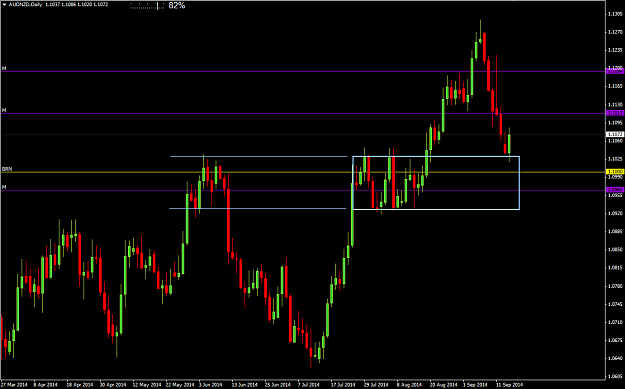
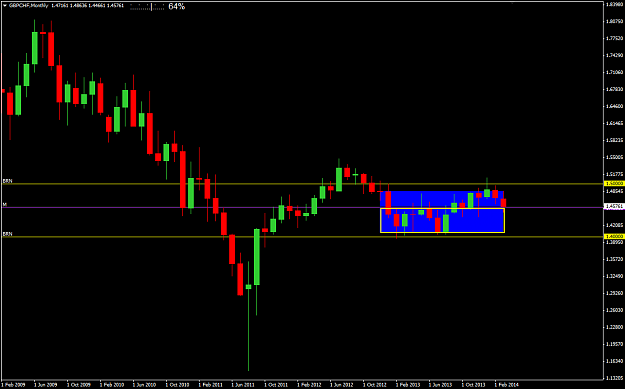
I see a messed up situation, with too many close levels and tight RMs. image
Beyond the Candles
- dfumagalli replied Mar 19, 2014
Hello, two suggestions: 1) If a level is not clear then don't draw it, much less use it. If it's not clear to you, it's probably not clear to many others and so the big traders won't really use it. You need them for reliable price action to develop. ...
Beyond the Candles
- dfumagalli replied Sep 18, 2013
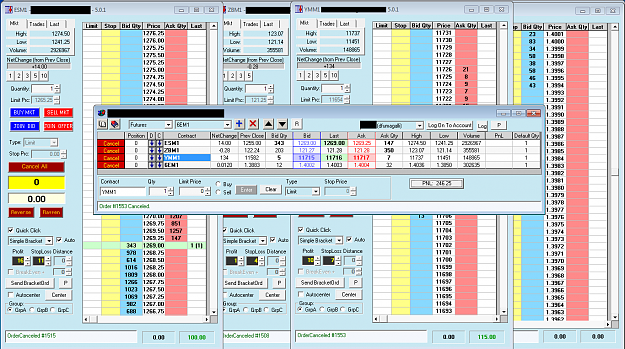
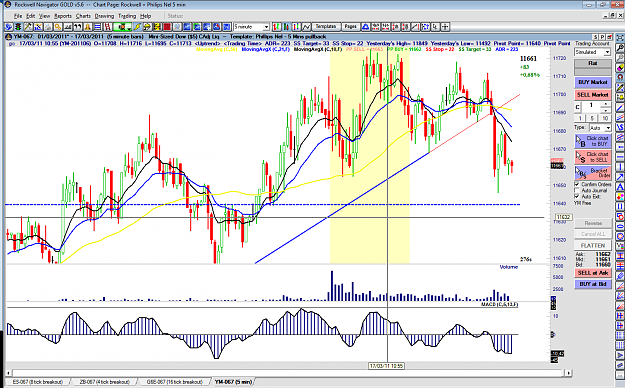
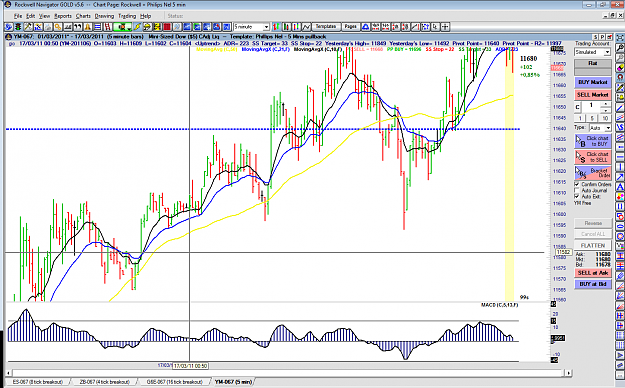
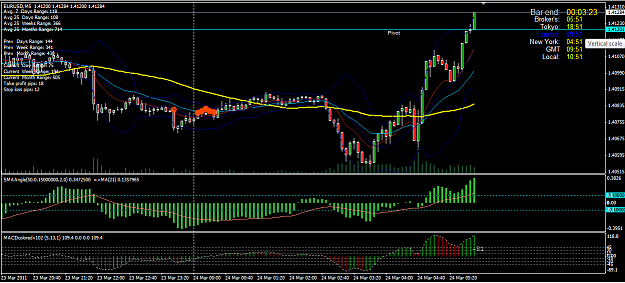
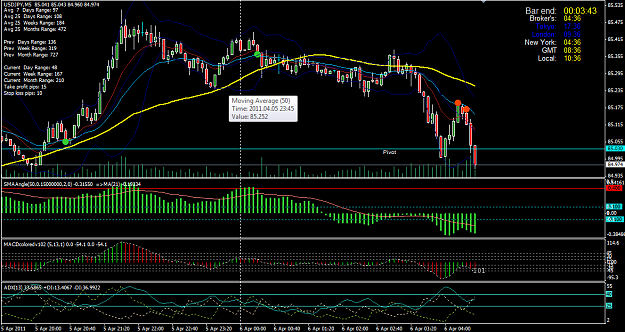
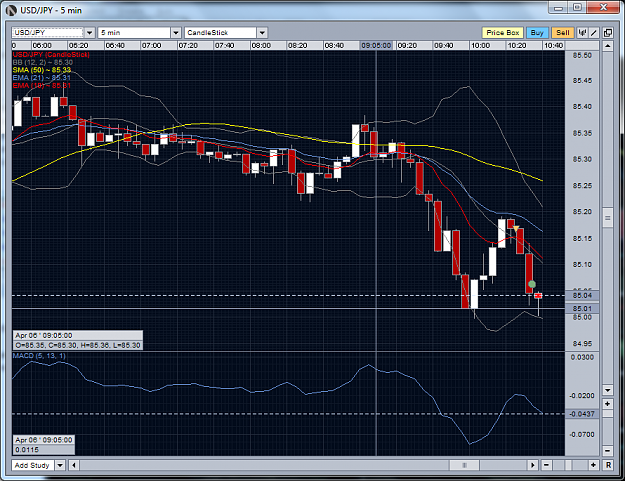
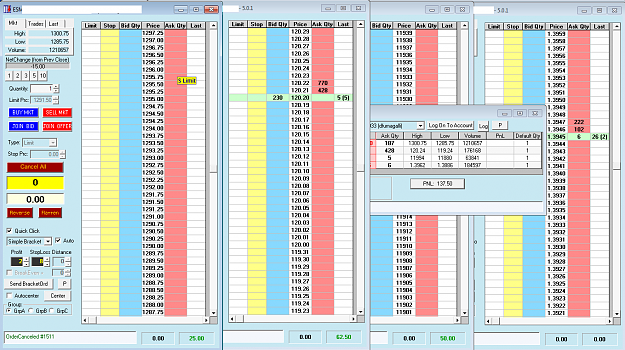
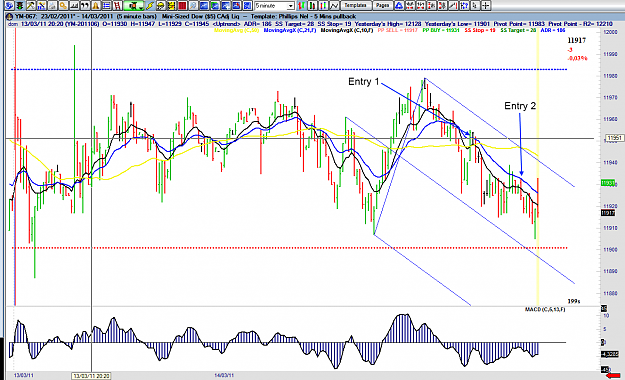
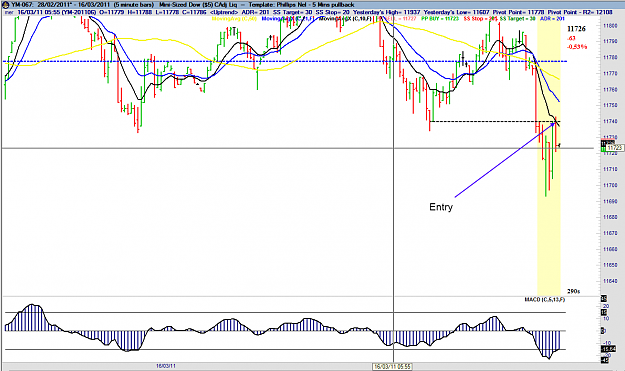
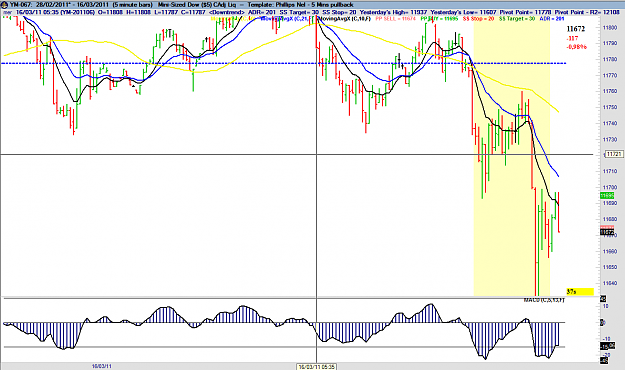
I have traded it a lot on the futures and Forex markets and it gave me satisfaction. Check the "Philips Nel" template layout on the platform and some P&L examples. The last two are the same trade screenshotted at signal received and what happened ...
5Min Intraday System
- dfumagalli replied Jun 28, 2013
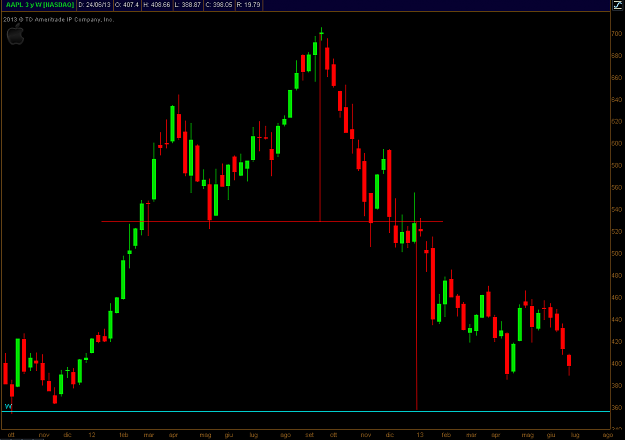
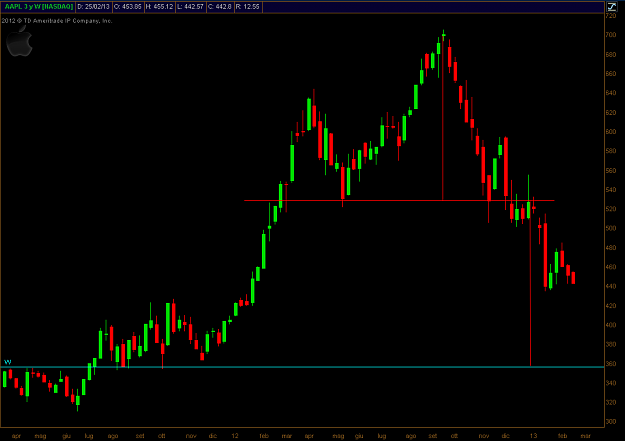
The power of price Anyone recalls this long past Apple Inc. analysis of mine? Look where price is today: image How many anywhere could claim to foresee the glorious Apple going this way and months in advance? Including where to use money ...
Beyond the Candles
- dfumagalli replied Jun 26, 2013
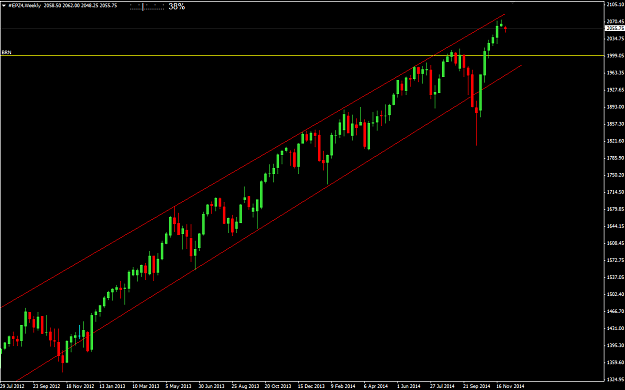
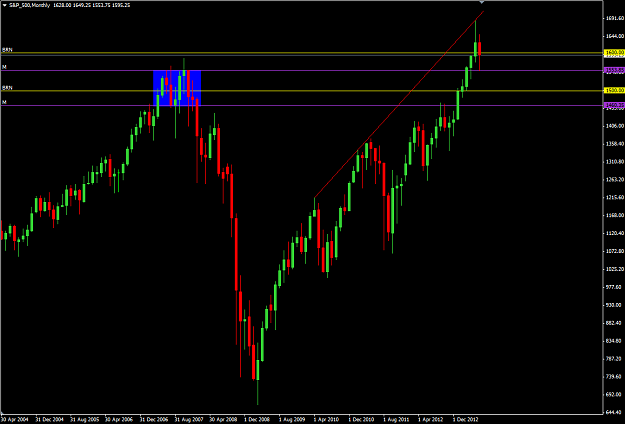
ES - E-Mini S&P Future Monthly chart WPD P is in uptrend and it closed below a long term TL with a counter trend PB. The PB has reached a first target, that is the monthly level, that is the 2007 RM resistance level. If this month will close without ...
Beyond the Candles
- dfumagalli replied Jun 19, 2013
I'd like to talk about your "what is that" in the M chart. At first sight it's a non pattern. It's a 2M PB that failed to form, as the 2nd bar did not close at or below the first bar open. But wait, this thread is called "beyond the candles" for a ...
Beyond the Candles
- dfumagalli replied Mar 10, 2013
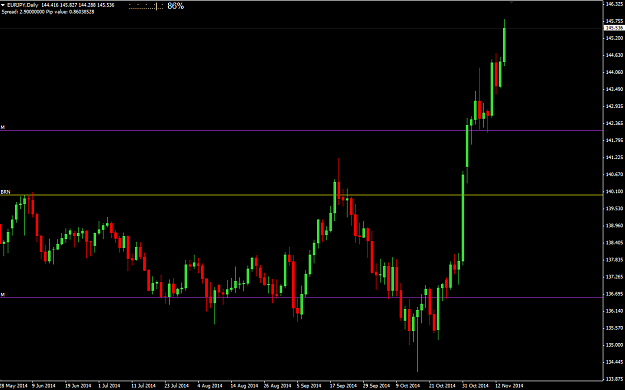
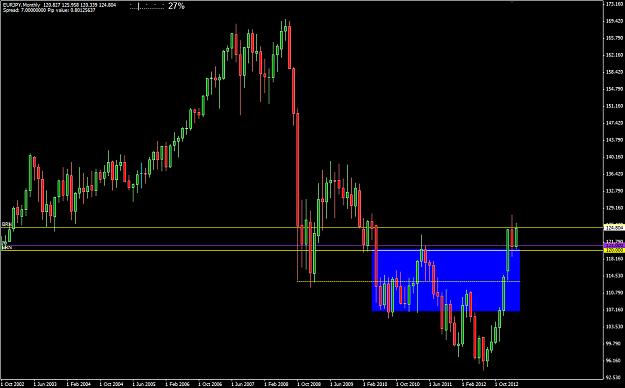
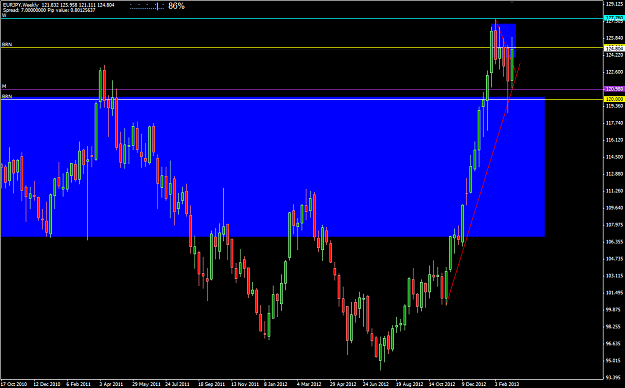
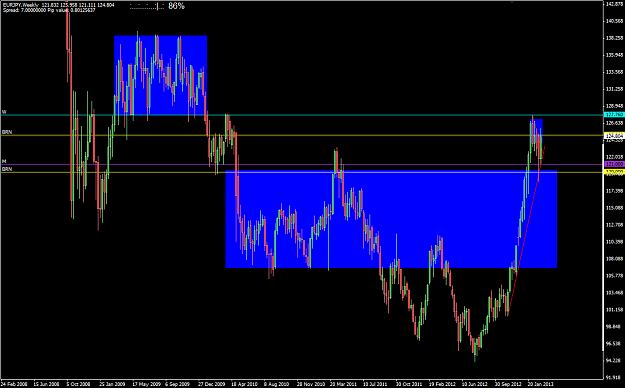
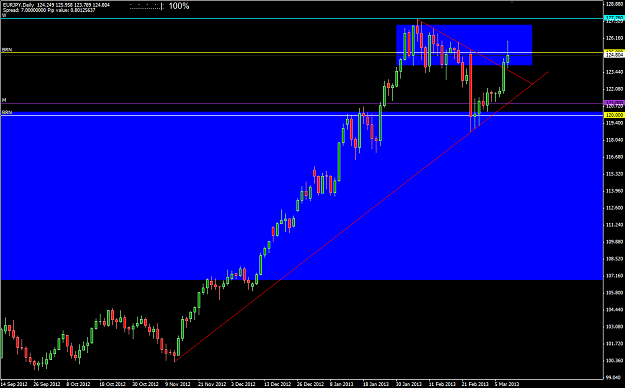
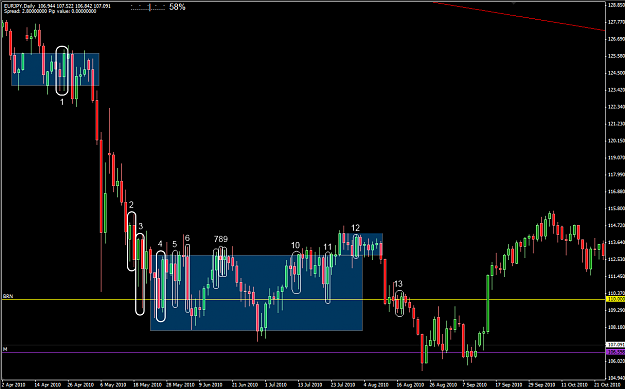
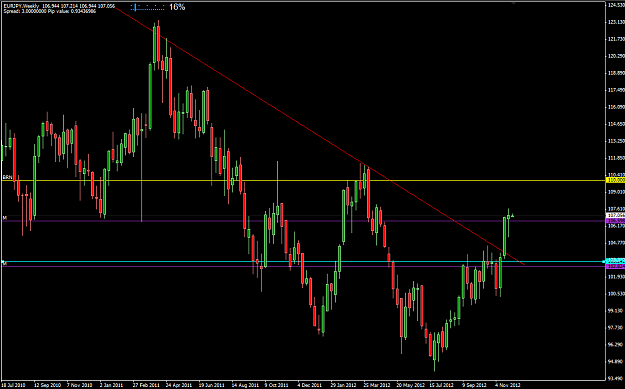
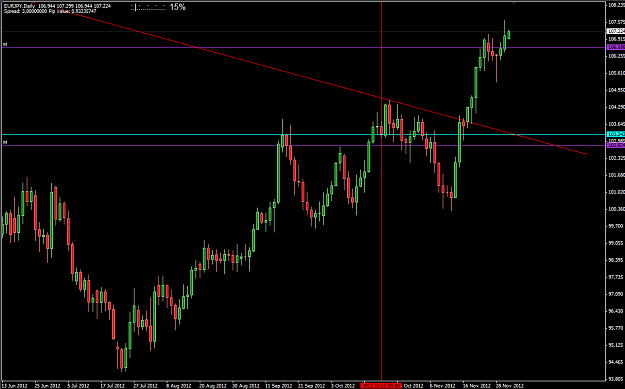
EURJPY Monthly chart [Attachment #1] What Price is Doing (WPD) Price has closed above a monthly range market (M RM). The yellow dashed line shows an important liquidity level that affected the RM development. Price is currently between two important ...
Beyond the Candles
- dfumagalli replied Mar 4, 2013
Two vital comments. 1) Remove that grid at once. It's totally confusing, can't read the price and it will adversely affect you to have those rogue lines when you do your analysis. 2) Post charts that can actually be read. Yours is huge yet the ...
Beyond the Candles
- dfumagalli replied Feb 25, 2013
Apple Inc: I hope I have drawn this correctly. If so, then the situation does not require words. Obligatory money management at around 420 (see swing all to the left).
Beyond the Candles
- dfumagalli replied Jan 13, 2013
The next step is for me to remind you what's this thread is about: "Beyond the candles". Now, this might sound like an odd reply but it's really the best I can give you. When you ask yourself "I see a PB / RM, what's next" you should ask yourself: ...
Beyond the Candles
- dfumagalli replied Dec 23, 2012
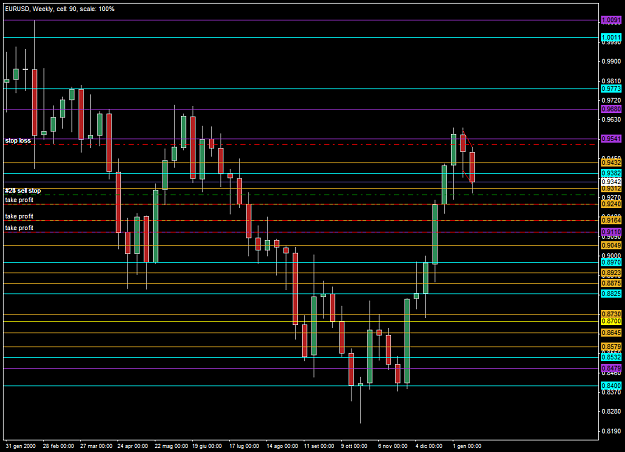
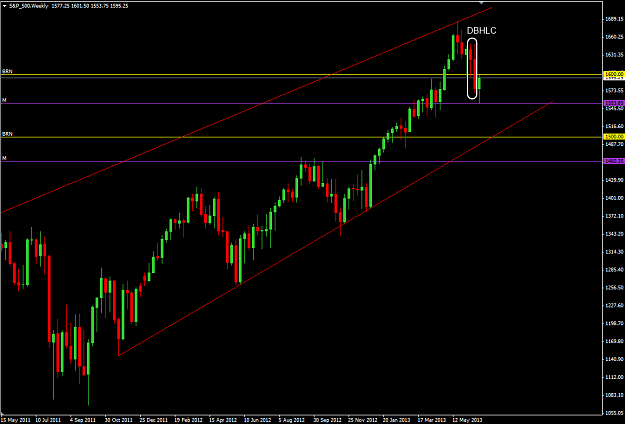
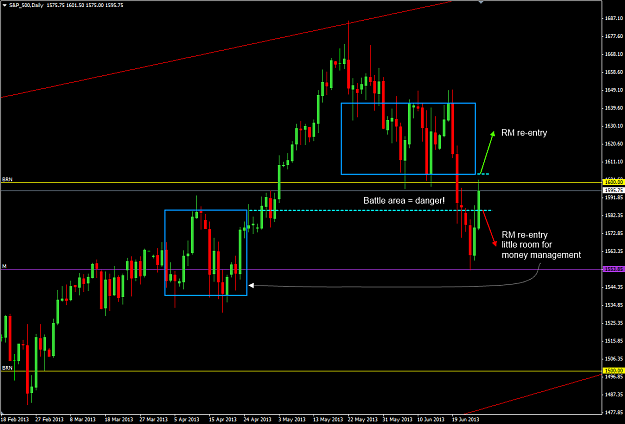
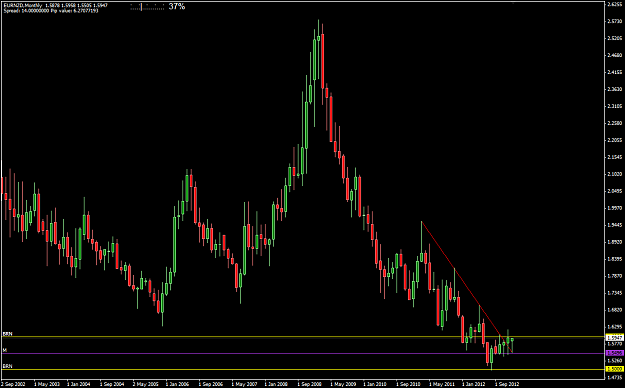
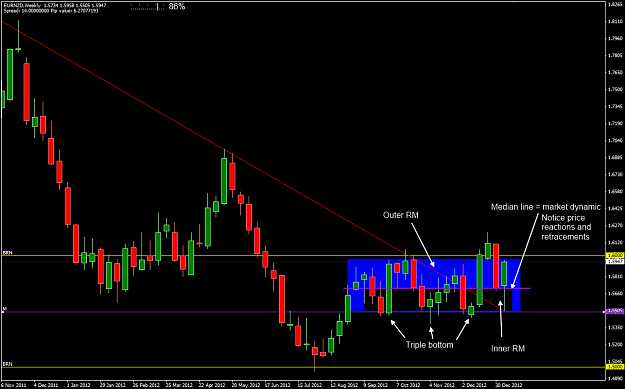
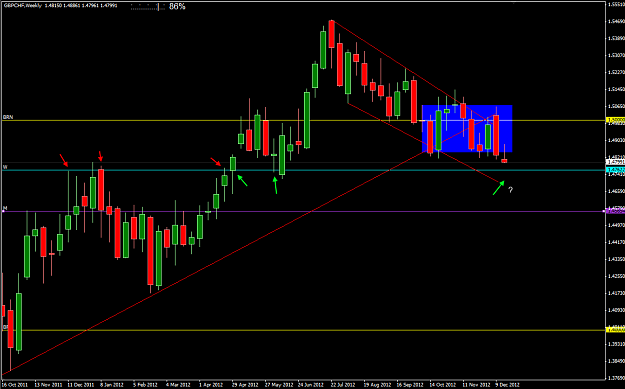
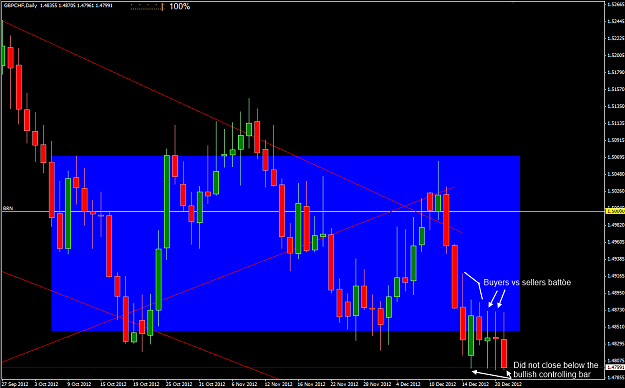
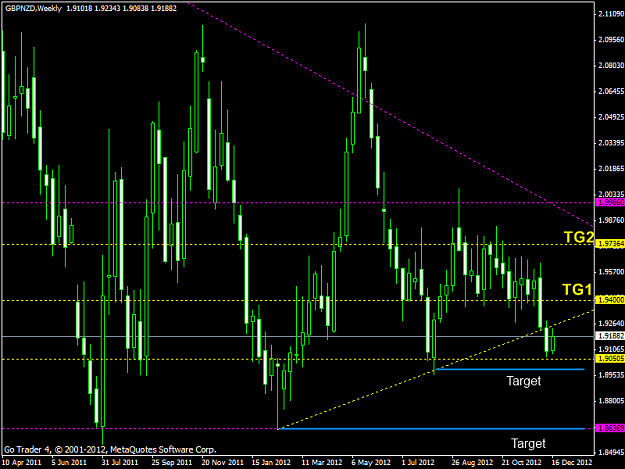
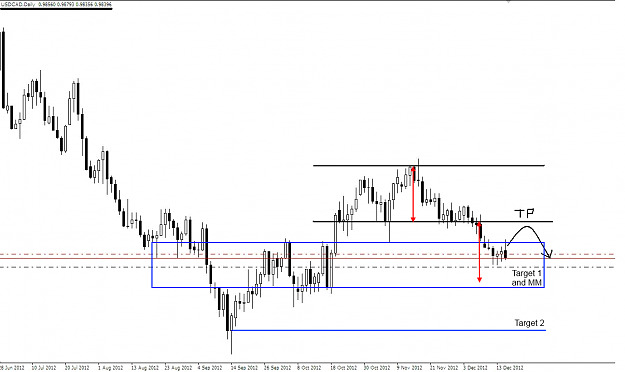
Hello, your setup might work perfectly but I am not going to take it. Attachment 1: weekly chart. look at how the bearish channel support is in the way, along with a quite potent weekly (cyan) level. Attachment 2: daily chart. Big buyers vs sellers ...
Beyond the Candles
- dfumagalli replied Dec 18, 2012
The correct way is: "what price is doing (WPD)?". If you understand it then you have to find "where price is going (WPG)"? If you have *any* doubt about WPD you are way, way better skipping the trade completely. Rule #1: capital preservation, and ...
Beyond the Candles
- dfumagalli replied Dec 18, 2012
My point of view, only quickly looking at your chart (and not on higher time frames).
Beyond the Candles
- dfumagalli replied Dec 3, 2012
You made me actually blush, keroro0o0o
Beyond the Candles . However I am not done with you yet!
 Here's another juicy reply for you and the other fellow traders based on another of your previous posts: I posted about this in the past but I'll restate ...
- dfumagalli replied Dec 2, 2012
I strongly suggest all the thread readers to read this post many, many times and ponder, ponder a lot about what I wrote. Because learning the mindset, the search for cues and training the eye may turn your trading career outcome. ---------------- ...
Beyond the Candles
- dfumagalli replied Oct 1, 2012
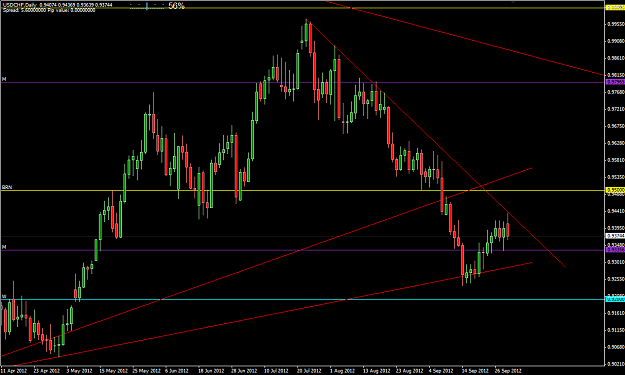
Update on USDCHF — As you can see, today price hit the trend lines drawn on Sept 22 (post above) by the PIP. Price is cool like that.
Beyond the Candles
- dfumagalli replied Jul 30, 2012
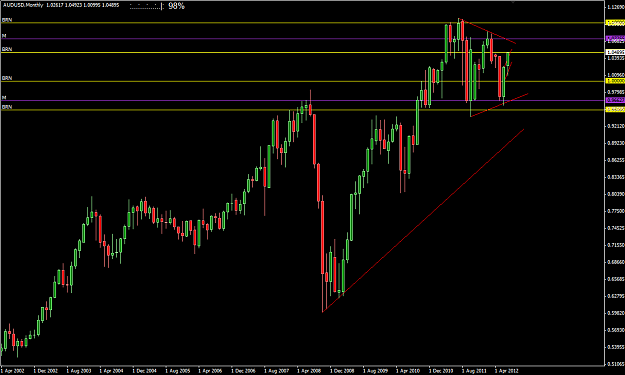
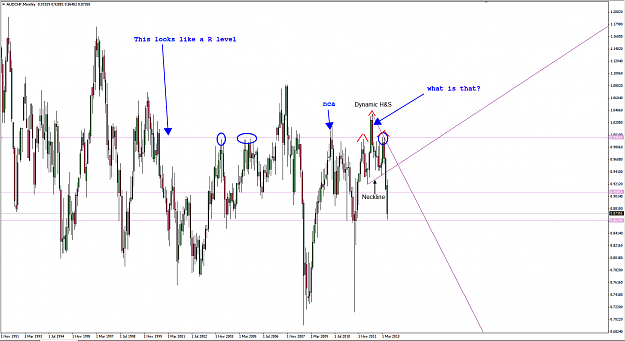
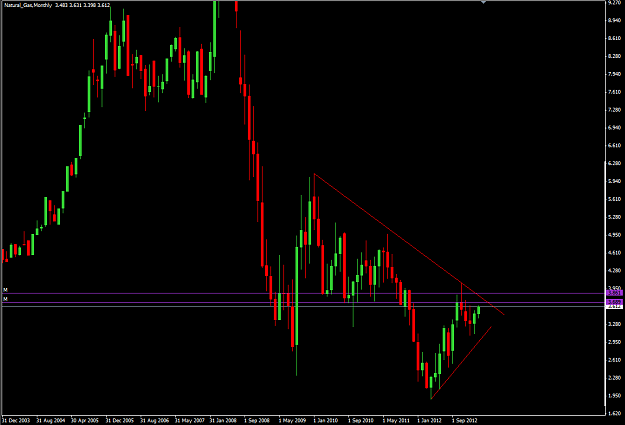
AUDUSD — Monthly chart (Attachment 1) WPD Price is inside a triangle. Buyers reacted to the very strong sellers of the past months and got price back up to BRN 1.05. The last bars form something similar to a multi-month pin bar but first: We ...
Beyond the Candles