- Search Forex Factory
- 83 Results
-
 FX Tsunami replied Jun 27, 2016
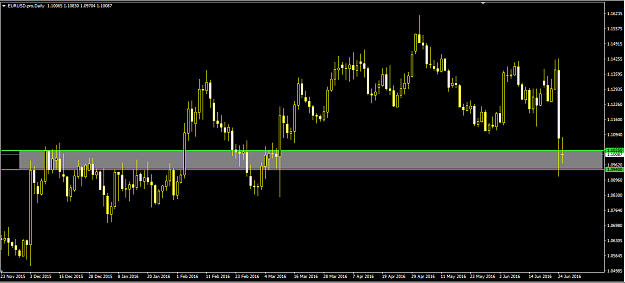
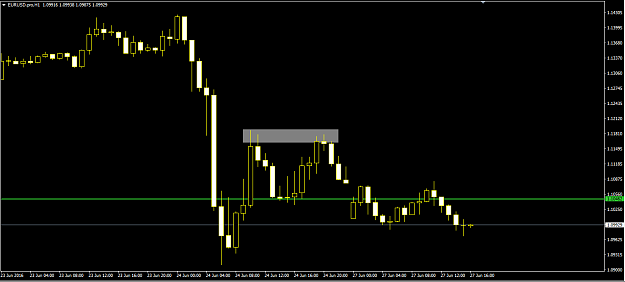
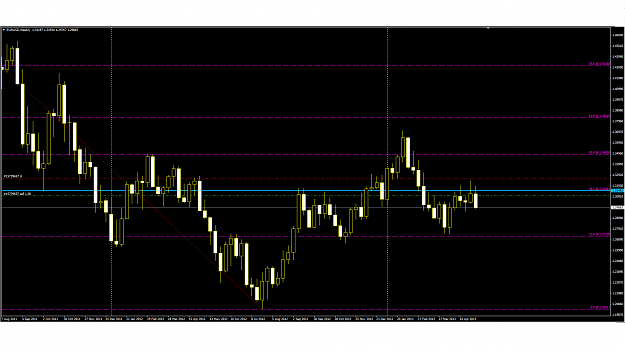
In my view, short positions gotta be wary until 1.0940 is taken out. May be we can hold existing shorts but safer addition could be below 1.0940.
EURUSD
- FX Tsunami replied Jun 27, 2016
Well, in that case can I consider that there's a double top too ??
EURUSD
- FX Tsunami replied Jun 23, 2016
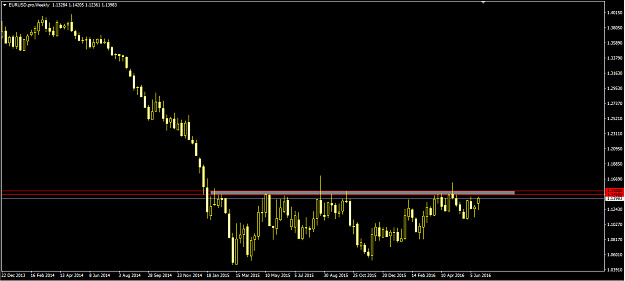
From what I could see, a 'Bremain' majority will help EUR to break a long standing supply region between 1.1450 and 1.1500 with potential targets as 1.1800 and 1.2300. On the other hand, if 'Brexit' wins we might see a spike to the mentioned supply ...
EURUSD
- FX Tsunami replied May 10, 2013
Looks like 1.3148 (38.2% of 2011&2012 high& low) holding pretty well....
EurAnalysis
- FX Tsunami replied Apr 29, 2013
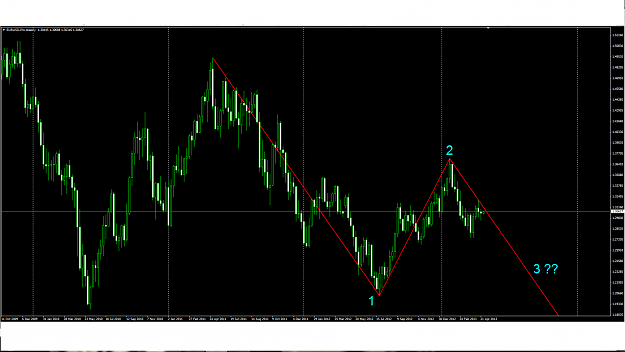
Is this wave count correct??? If so, is the E/U really gonna fall hard?? And that too, 3rd wave coming, I can't imagine where this pair is gonna land
EurAnalysis
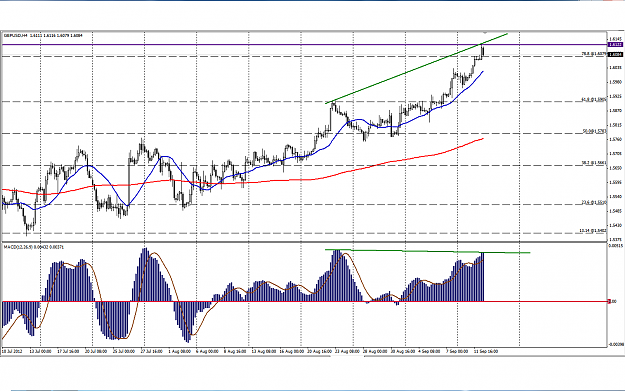
- FX Tsunami replied Sep 12, 2012
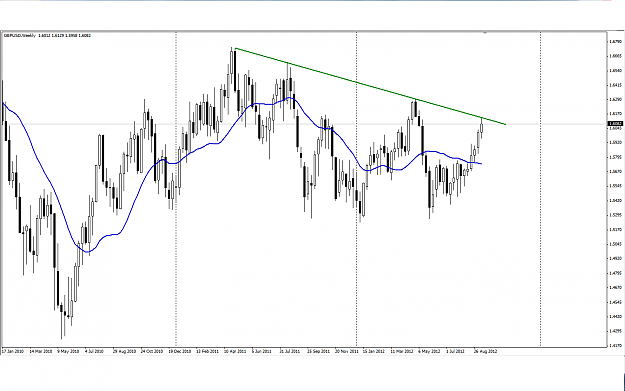
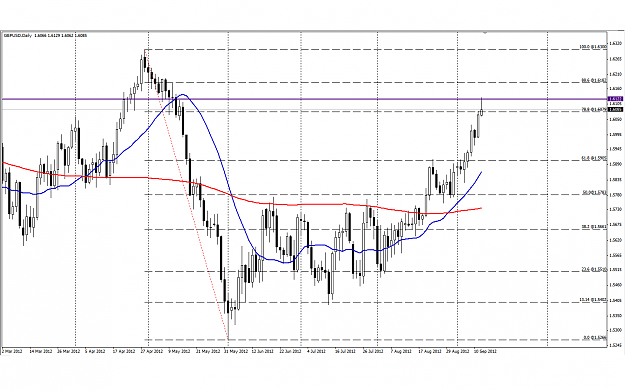
GU — Hello guys, Sorry for posting non-EU chart. Since I found GU as a good entry, you guys can consider it. I see a good trend line resistance in weekly chart. 1.6122 seems to me as a solid resistance. Price has reacted well for the point in ...
EurAnalysis
- FX Tsunami replied Sep 11, 2012
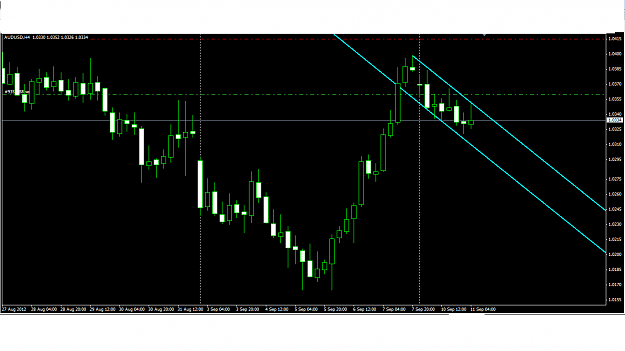
Bull flag ??? — Holding a short from 1.0360. Now this flag thing worries me....
AUD/USD

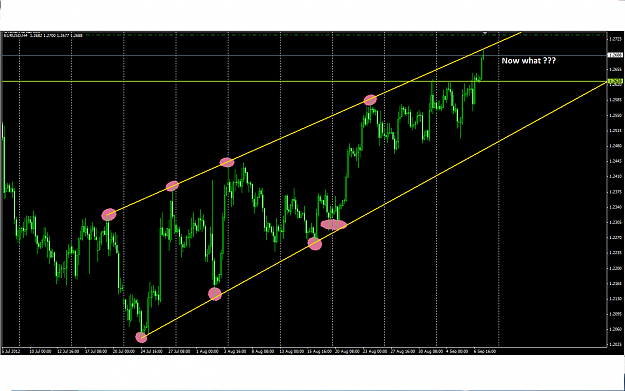
- FX Tsunami replied Sep 7, 2012
2690 or 2740 ?? — I think I'm missing a wonderful short opportunity.... NFP would most probably be in favour of USD.... Anyway I've got a sell limit @ 2735 wiht 2770 as stop... Good luck everyone !!!
EurAnalysis
- FX Tsunami replied Jun 25, 2012
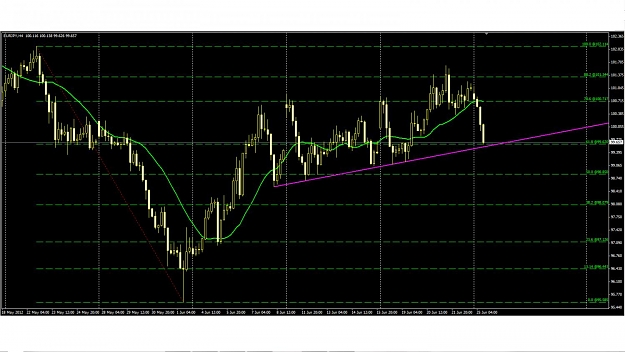
EJ — No bias to long now because of euro weakness. Just a caution for whom considering to short now. ADD: May be I will short once the support is breached. (However I'm aware of BOJ intervention. So with small lot). Why worry when we have EU ...
EurAnalysis
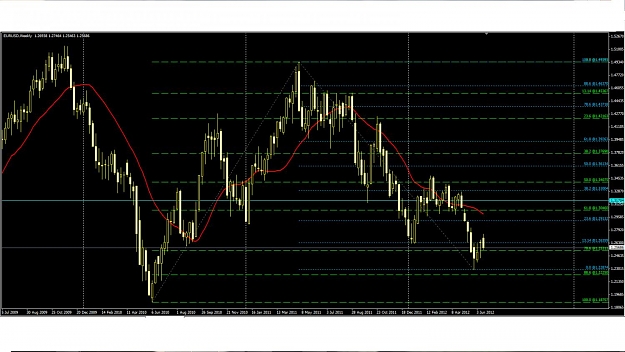
- FX Tsunami replied Jun 21, 2012
Daily BB mid approaching. Also I see a 78.6 FIB (Drawn b/n 2010 low and 2011 high) @ 1.2531. Will they hold for sometime atleast ??? May be from where we get the "Most Wanted" retracement (to around 1.2600). Guess so. A weekly close below 78.6 FIB ...
EurAnalysis
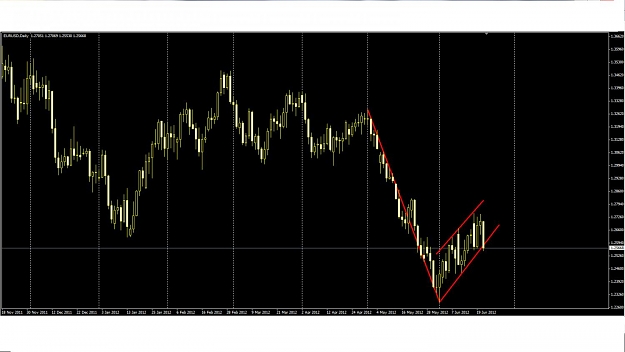
- FX Tsunami replied Jun 21, 2012
Bear sneaking out in DAILY ??? — What about this ??? Bear formation in Daily....
EurAnalysis
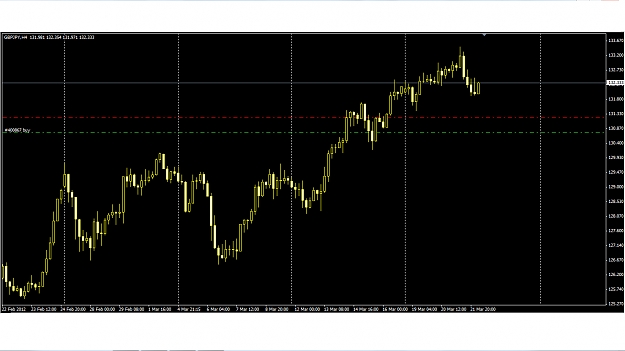
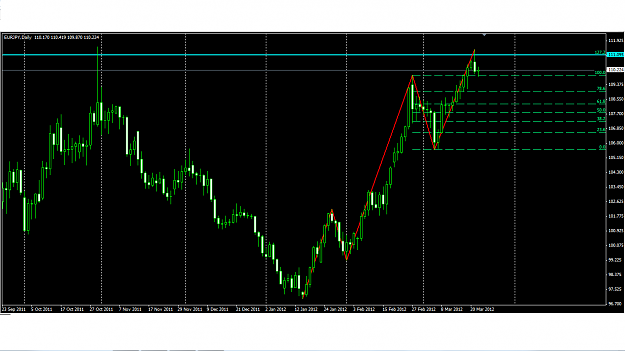
- FX Tsunami replied Mar 22, 2012
Yeah mate. I agree. Infact i've got a buy in GJ running since last week. And opened a small lot in EJ now
EurAnalysis
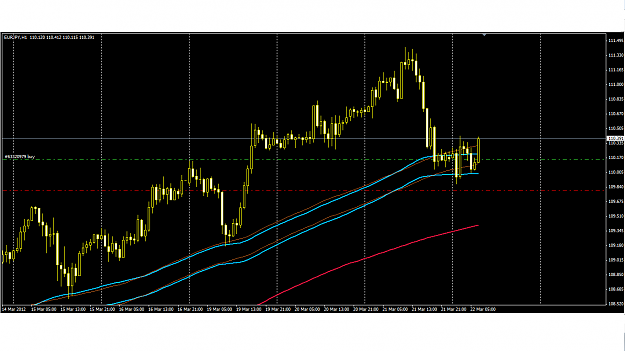
- FX Tsunami replied Mar 22, 2012
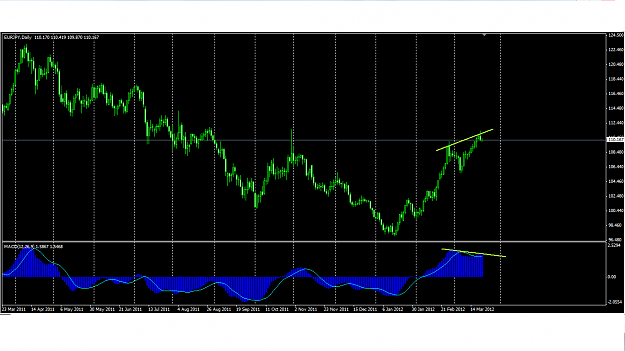
Divergence !!! — 5 impulsive waves completed in Daily chart. MACD shows bearish divergence. So according to be, at least correction is due to happen if not a big fall. Sorry for EJ chart. Posted it because it might influence EU movement too.
EurAnalysis
- FX Tsunami replied Mar 15, 2012
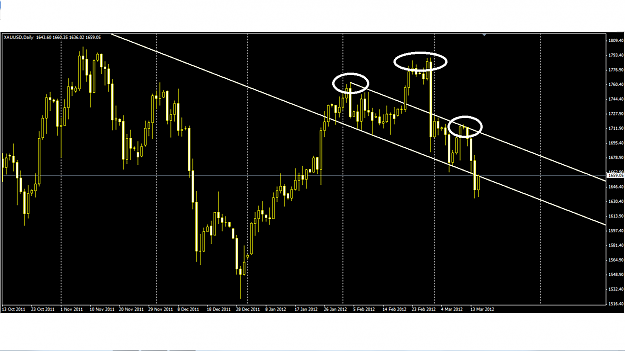
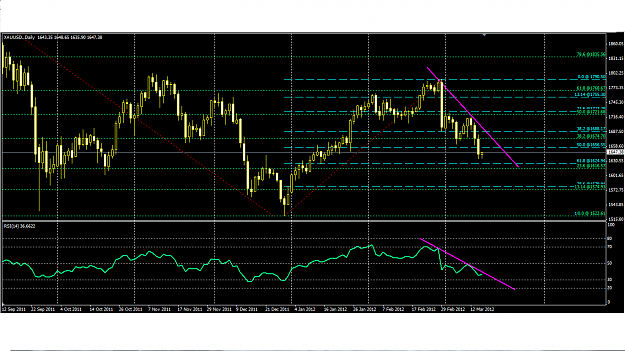
Hello PT, Sorry to be off the topic. Can you please tell me whether this formation in Gold can be considered as a H&S ??
EurAnalysis
- FX Tsunami replied Mar 15, 2012
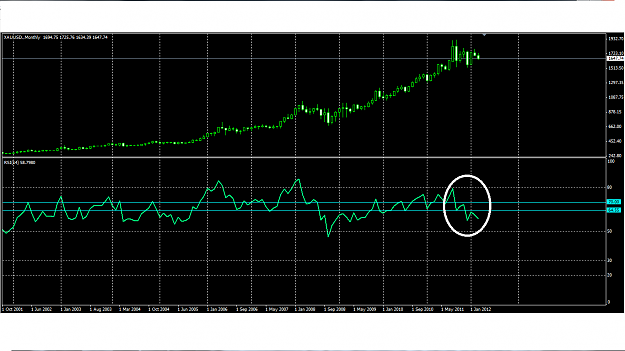
Hello jsr, First of all i appreciate for the time taken to read and i thank you for the appreciation. I hope it have helped in some way or the other. I'm sorry that I didn't mention about monthly RSI. To be frank, i never considered it earlier. When ...
XAU/USD & XAG/USD - Gold & Silver Traders Thread
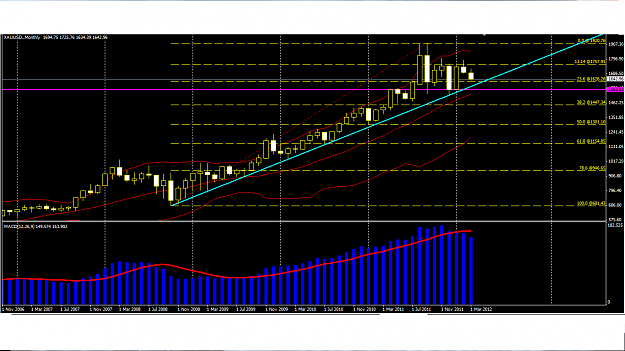
- FX Tsunami replied Mar 15, 2012
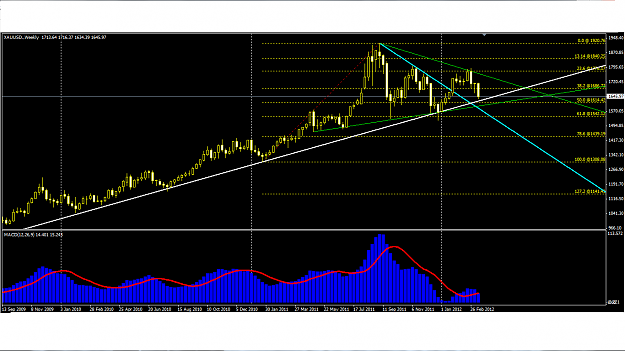
My technical view on GOLD — Hello friends, Below is my view on GOLD. MONTHLY CHART: A correction in happening. It is what I see at a first look into monthly chart. 1757.90 (13.14% of FIB) has been a significant resistance preventing to raise ...
XAU/USD & XAG/USD - Gold & Silver Traders Thread

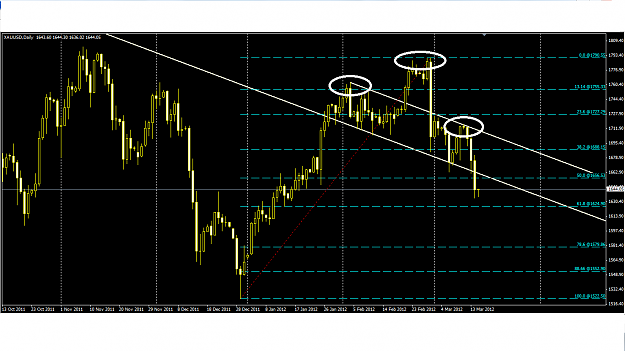
- FX Tsunami replied Mar 14, 2012
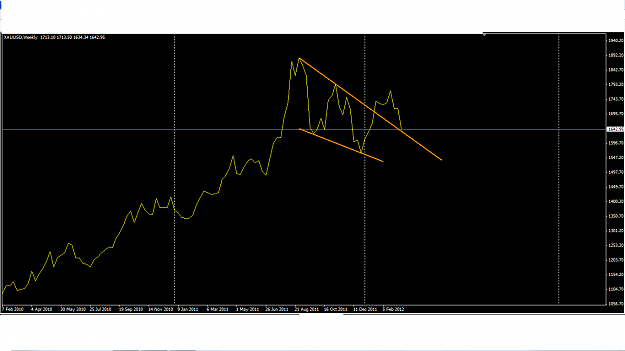
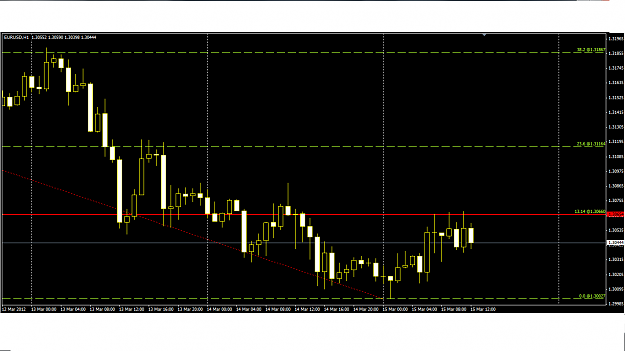
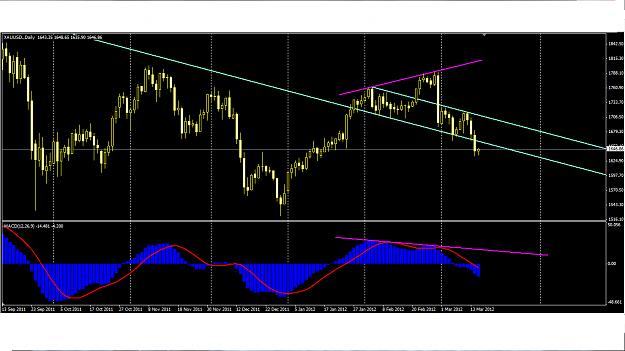
H & S ???? — I ain't sure how far this consideration can be correct. If H& S, then price would drop further. May be a fall after re-testing the falling neck level where 50% of the FIB also lies. So watch 1650 to 1660 area with caution. FXT
XAU/USD & XAG/USD - Gold & Silver Traders Thread
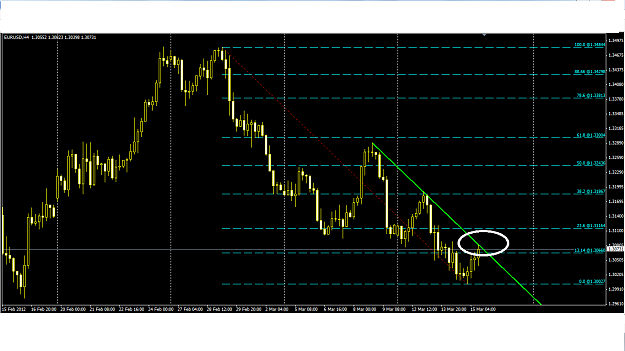
- FX Tsunami replied Mar 14, 2012
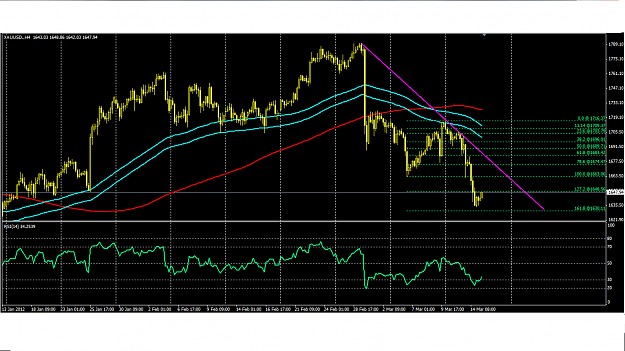
Beware !!!! — May be a re-test of the broken falling wedge. Might start a nice bull trend here. Or to be precise, 1620 to 1624 should be a perfect long entry. Not sure about this though. Will watch PA closely. Chart attached. FXT
XAU/USD & XAG/USD - Gold & Silver Traders Thread