- Search Forex Factory
- 34 Results
-
 micmic replied Sep 19, 2014
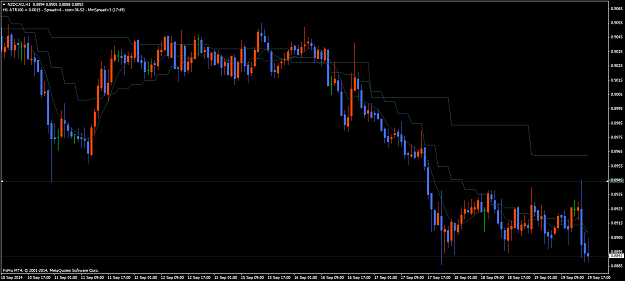
I may lose 200 pips in a trade and don't mind much. But in other trades I may lose a single pip and keep cussing until the next day, because it was SO stupid!. Like in that NZDCAD trade, I only lost 22 pips (plus the downward move that will follow, ...
Three-toed Sloth trading
- micmic replied Sep 11, 2014
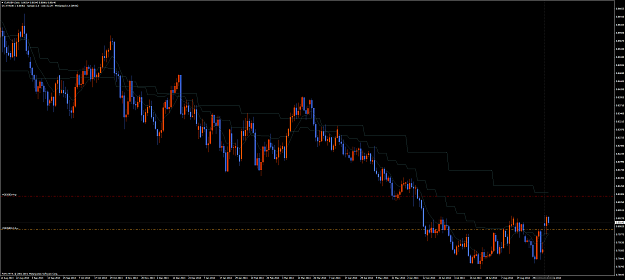
A couple of new entries according to the rules: Closed positions NZDJPY long: -20 pips Open positions USDCHF long: +200 pips NZDJPY long: +2 pips EURNZD short: +26 pips GBPZAR short: -129 pips The GBPZAR trade isn't going very well and since it was ...
Three-toed Sloth trading
- micmic replied Sep 10, 2014
EURGBP came back and hit my stoploss. Good thing I had it placed at BE, it's not like you can trust this whore of currencies, EUR, to show any character. I wouldn't be surprised if it goes back up now. Guess who's short in GBPZAR. SL too big for my ...
Three-toed Sloth trading
- micmic replied Sep 10, 2014
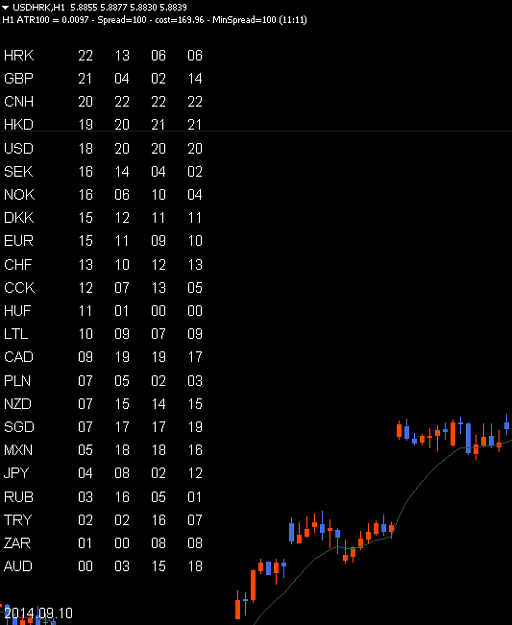
Meanwhile, in the exotics department, the continued USD strength means that any longish-term trade of a USD pair will most probably have to tolerate negative swap. Of course we can go really tropical exotic, deep sun tan and all, and start looking ...
Three-toed Sloth trading
- micmic replied Sep 10, 2014
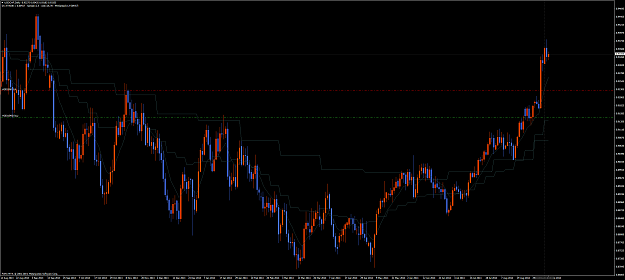
Long time no see! Not much has changed, I'm still trading basically S/R with several twists. At the moment I have two trades open, EURGBP long (sl moved to be) and USDCHF long (about 80 pips profit locked).
Three-toed Sloth trading


- micmic replied Feb 28, 2012
I've almost finished the trendline-drawing function in my indicator and it's pretty good. It draws 1 bullish and one bearish trendline on every chart - if it can find them. Not only it will help the automatic part of the trading, I also expect that ...
Three-toed Sloth trading
- micmic replied Feb 22, 2012
I think I have found an effective way to automatically plot levels, and this shows especially powerfully in some charts. For example, this 4H AUDCAD, where simply trading the touch of the two S/R levels with the suggested SL of 35 pips and a R/R of ...
Three-toed Sloth trading
- micmic replied Feb 22, 2012
I am pretty impressed by the performance of the trendlines plotted by my indi on the EURUSD today. Of course the main pivotal level for today was the 1.3233 line. And since the market was so choppy, many people didn't trade the EURUSD at all or ...
Three-toed Sloth trading
- micmic replied Feb 21, 2012
Here's a simple plan for an unusual pair, USDSGD: For this pair and the 15 min timeframe, I consider an S/R level to be broken if price has moved at least 14 pips beyond that level. If price reverses at least 14 pips near that level, then I consider ...
Three-toed Sloth trading
- micmic replied Feb 21, 2012
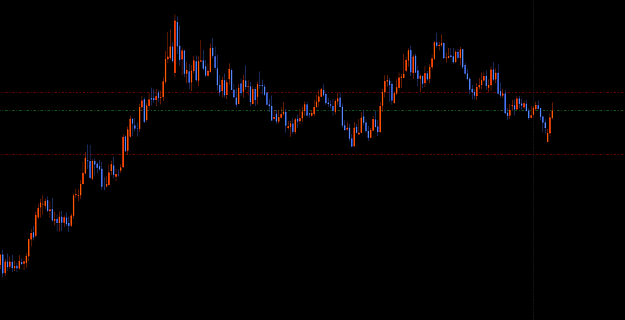
And here is an example chart with the S/R levels on it:
Three-toed Sloth trading

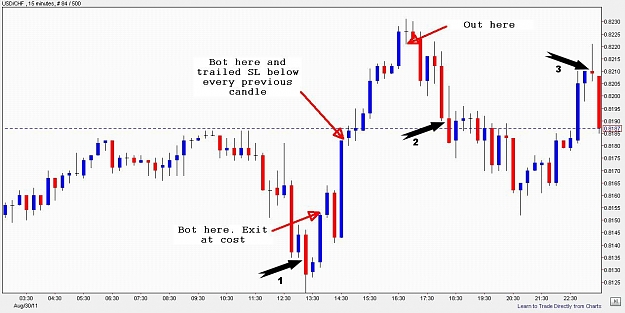
- micmic replied Aug 31, 2011
Could you please explain why you didn't sell at 1 & 2 and why you didn't buy at 3 ?
Price action momentum trading
- micmic replied Jul 27, 2011
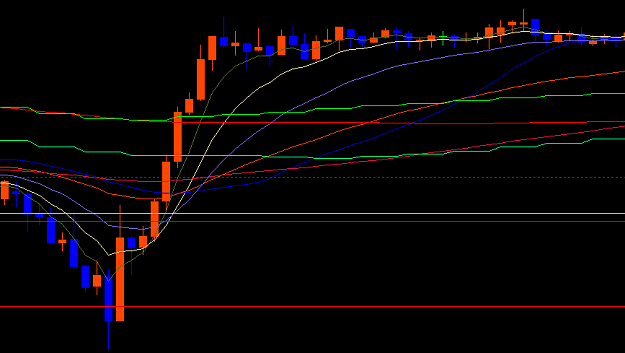
That's a difficult question and the answer is never going to be clear. An easy answer would be to reset the counter when the 5EMA crosses the 10EMA, but there are cases like the one below where you must reset the counter even if the 5EMA doesn't ...
CHOROS System
- micmic replied Jul 27, 2011
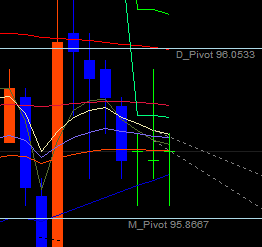
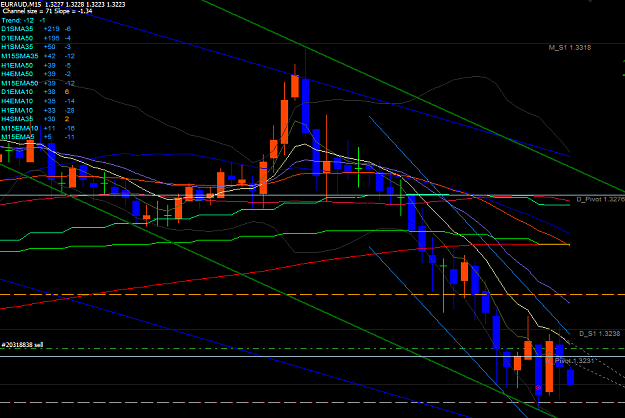
Another example of how looking at past candles can't tell the story accurately. Here, what appears to have been a 10EMA touch, never happened in real time. Price didn't even touch the 10EMA projection at the time (the dashed line).
CHOROS System
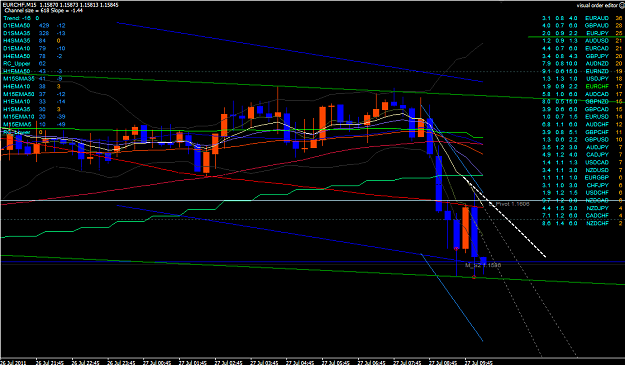
- micmic replied Jul 25, 2011
The indi spotted this constrainment in EURCHF today but with a low score due to some experimentation with the settings I've been having. Lots of infrastructure work since Friday. I'm not adding any more evaluation criteria (not that I can think of ...
CHOROS System

- micmic replied Jul 22, 2011
Yes. This one has reached a pip from the take profit and it looks like it can hit it:
CHOROS Interactive
- micmic replied Jul 22, 2011
This is how it would look at the moment of the trade:
CHOROS Interactive

- micmic replied Jul 21, 2011
Very nice candle formation in CHFJPY now, you don't often see this
CHOROS System