- Search Forex Factory
- 43 Results
-
 Ifty replied Jun 3, 2011
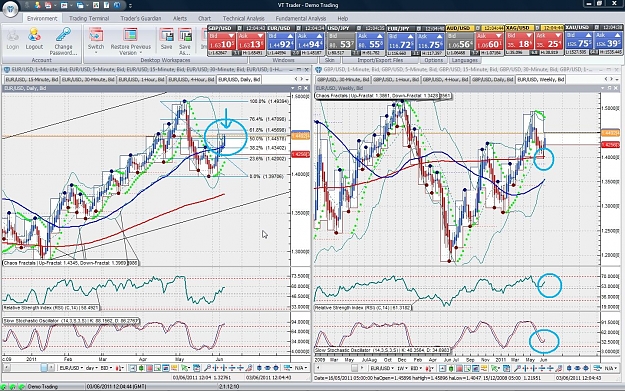
Daily/Weekly EU — When the parabolic sar broke down on the weekly I though 'yes' time to sell sell sell but it has only managed about 300 pips (from the break), however, since then it has retraced nearly 500 pips back to the upside. Weekly is ...
The WoRmHoLe
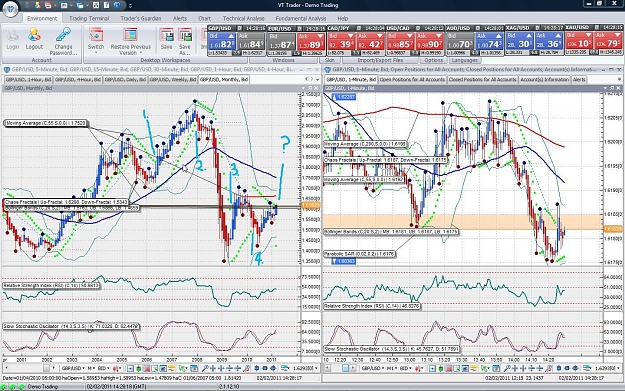
- Ifty replied Feb 2, 2011
Hi Azim and everyone. Hope you are all well. Not been around for a few days but blimey cable has gone a bit crazy. Not going to think too much on shorting for the next few months as Azim has pointed out. Reason below:- The PARABOLIC SAR has broken ...
Cable Update (GBPUSD)
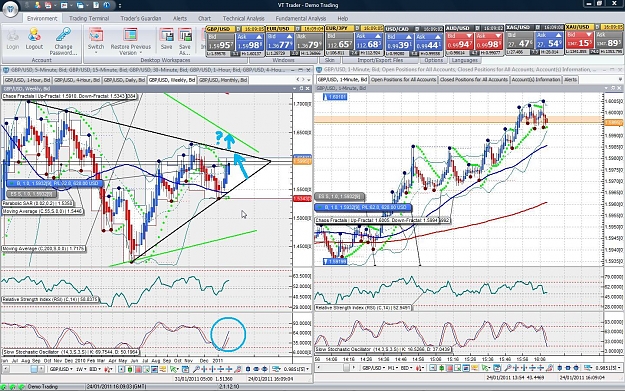
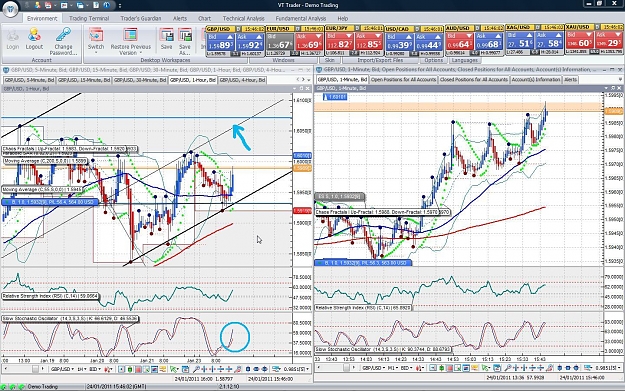
- Ifty replied Jan 24, 2011
A lot of us (including me LOL) are dying to short GU to 1.50 - 1.47 etc etc but presently we should not ignore the weekly which is BULLISH. There is resistance at the black TL (1.6180) then 1.63 and even 1.65 seems to be possible. Stochastics are UP ...
Cable Update (GBPUSD)
- Ifty replied Jan 24, 2011
IH stochastics pointing higher quite nicely. 55 day MA acted as support(blue line). Parabolic sar also broken to the upside. Will remain in trade until the TL (blue arrow) is reached or when the stochastics start pointing down OR when the parabolic ...
Cable Update (GBPUSD)
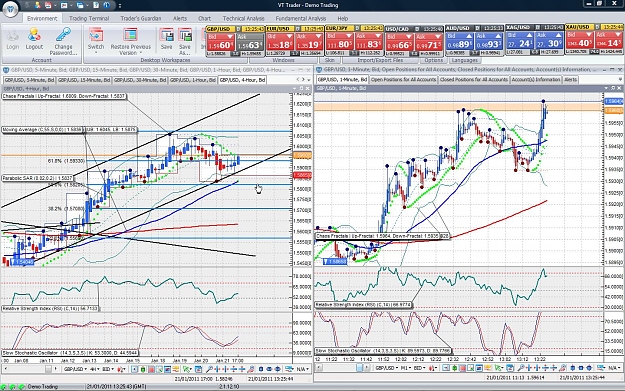
- Ifty replied Jan 21, 2011
Something to consider. If this 4 hour channel plays out then there could be a chance of 1.62. The 4H parabolic sar has also broken to the upside. Good luck. image
Cable Update (GBPUSD)
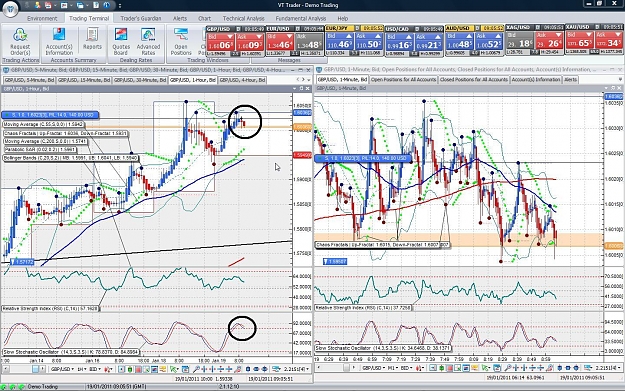
- Ifty replied Jan 19, 2011
The 55 day moving average on the 1H has been acting as solid support since last week and continues to hold. The stochastics are pointing down for the moment but I am hoping for a test of todays high at least to get a better shorting price. If ...
Cable Update (GBPUSD)
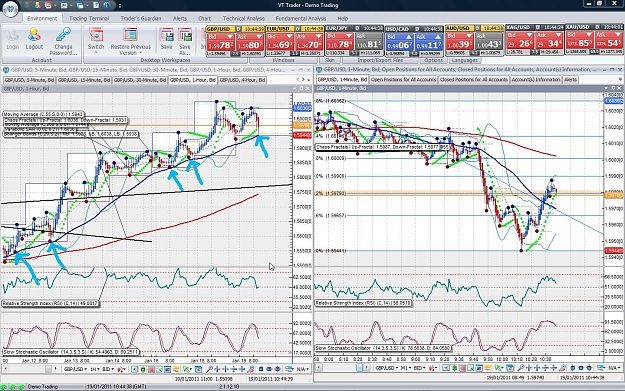
- Ifty replied Jan 19, 2011
Stochastics pointing down on the 1H. 2 bearish Heikin Ashi candles so far. There is news out in 30 mins so need to be careful. As soon as price drops below 1.60 will place SL to BE. See how it goes. image
Cable Update (GBPUSD)
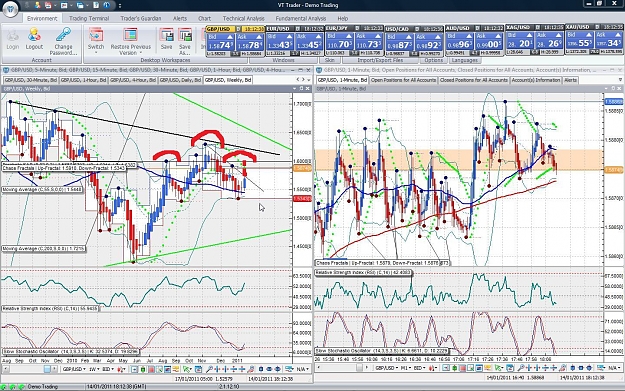
- Ifty replied Jan 14, 2011
H & S? — Hi Guys, need your opinions on the chart below (WEEKLY, left hand side). Not very familiar on chart patterns but if the price goes to 1.60 then would you say there is a potential for a H & S setup? Both the stochastics and RSI ...
Cable Update (GBPUSD)
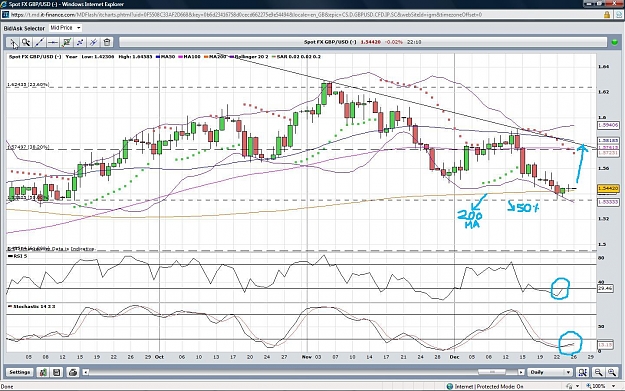
- Ifty replied Dec 26, 2010
My beloved VT2 is closed so using IG Markets chart for now. I am not going to trade the retrace (?) below but will wait for a daily RED candle to short. Time of the year is a bit dodgy so nothing wrong in waiting. If you are going to trade then ...
Cable Update (GBPUSD)
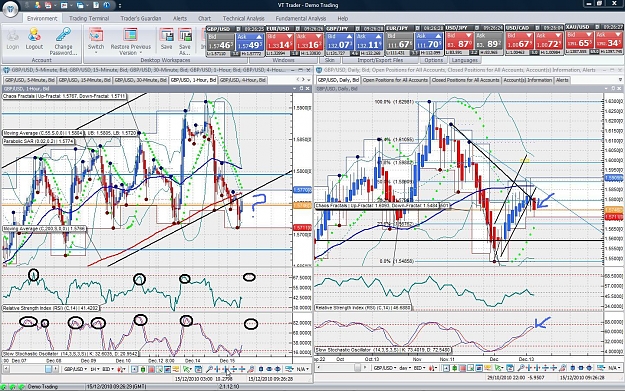
- Ifty replied Dec 23, 2010
The overall weekly/monthly trend is DOWN. However, wanted to point something out. When the stochastics went into the oversold area, the daily retraced approx 630 pips & then 420 pips. It's entered the oversold area again. Will it retrace here again? ...
Cable Update (GBPUSD)
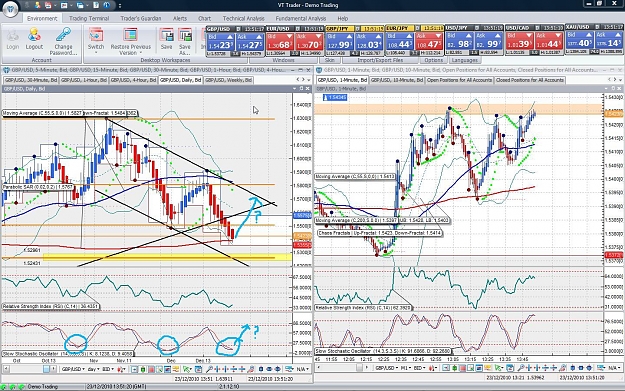
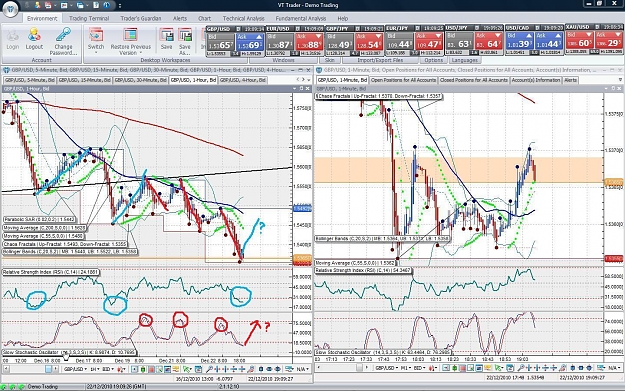
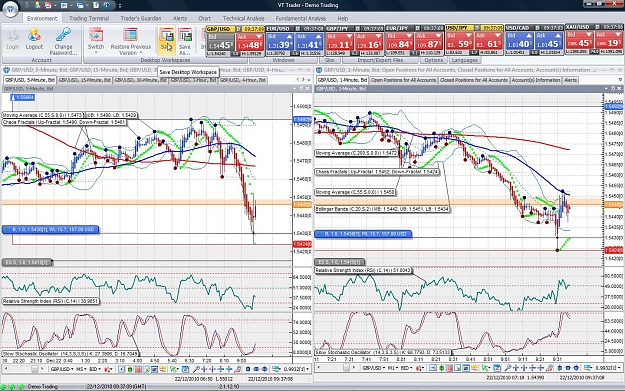
- Ifty replied Dec 22, 2010
1) GU has been bouncing off the 55 day MA (blue line). 2) See the oversold areas on the RSI after which there has been a retrace to the 55 day MA. 3) OR when the stochastics have been overbought it has then moved down. Because the overall trend is ...
Cable Update (GBPUSD)
- Ifty replied Dec 22, 2010
Took a chance on the spike as the 5 min RSI & stochastics were in overbought area. As soon as the 200 day MA is reached or the stochastics points down, I wil exit. image
Cable Update (GBPUSD)
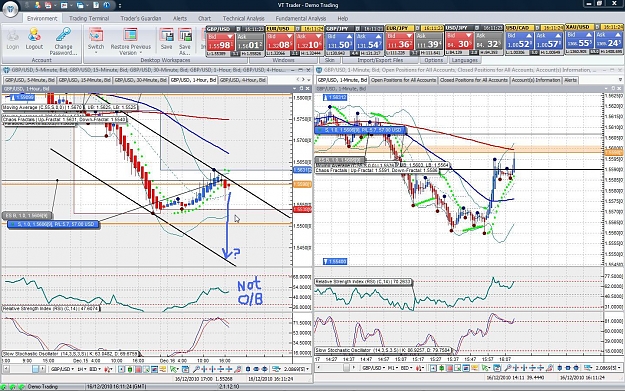
- Ifty replied Dec 16, 2010
Looks like I'm going to be taken out at BE but not that bothered as I'm trying to exercise my mind for longer TF trades (30 min, 1H & 4H). The RSI on the 1H was was not OB when I entered, only the stochastics. The 4 hour stochastic is up so will ...
Cable Update (GBPUSD)
- Ifty replied Dec 16, 2010
See what happens. SL at BE. Maybe a bit too soon but protecting one's account is very important. image
Cable Update (GBPUSD)
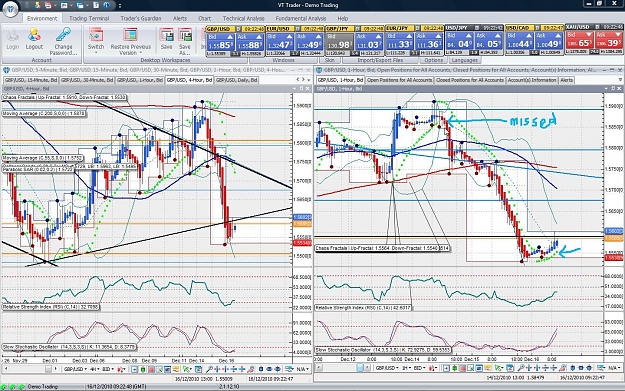
- Ifty replied Dec 16, 2010
Total pips this week = 71, very disappointed especially with the amount of movement but I'm happy when I think about not losing. Missed the PSAR break on the 1H but will go for the next opportunity. image
Cable Update (GBPUSD)
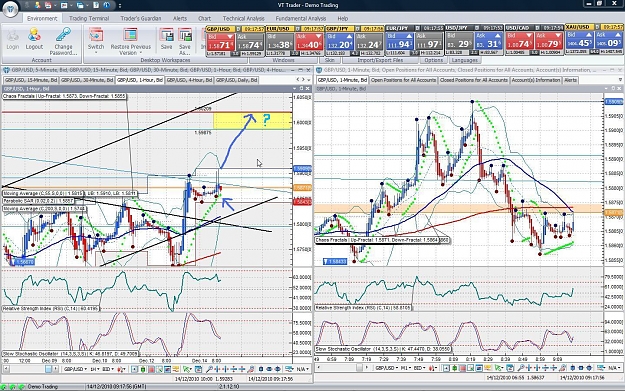
- Ifty replied Dec 15, 2010
Wish I took the parabolic break yesterday (1H) oh well, need to be stronger in the mind. Daily looking bearish for sure. Will wait for the 1H to retrace before entering short. Not guaranteed (obviously) to retrace but here I need to be patient. ...
Cable Update (GBPUSD)
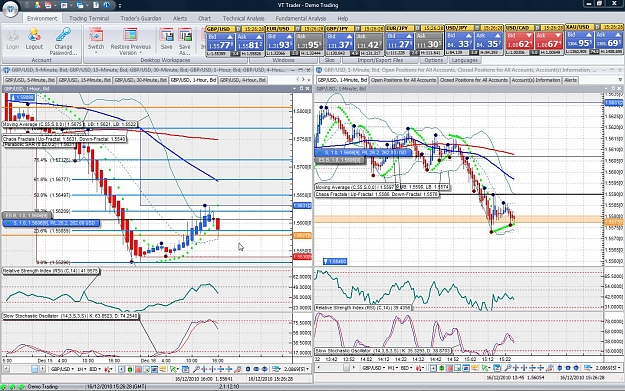
- Ifty replied Dec 14, 2010
1H bounces off the 200 day MA once again but how high will it bounce?The RSI & Stochastics pointing up. I am hoping either for a double top (high today) or maybe even 61.8% at 1.5986. Whatever happens I am gearing up my short trades at them prices. ...
Cable Update (GBPUSD)
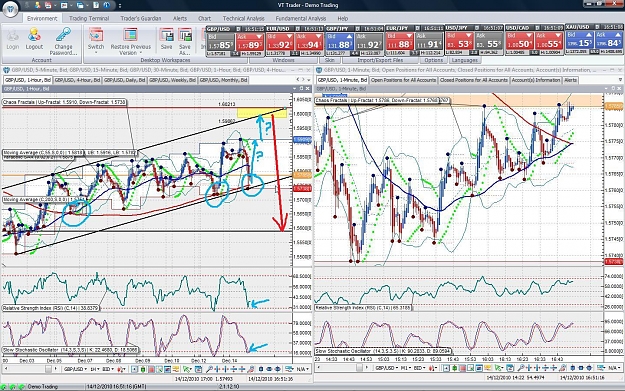
- Ifty replied Dec 14, 2010
Hi Guys, flat at the moment. PSAR not broken yet but also not enough power to go down so waiting. Maybe look around the 61.8% of daily at 1.5986 (or around the yellow box region) to short, not sure yet. Remember the 1.60 is a big round number so ...
Cable Update (GBPUSD)
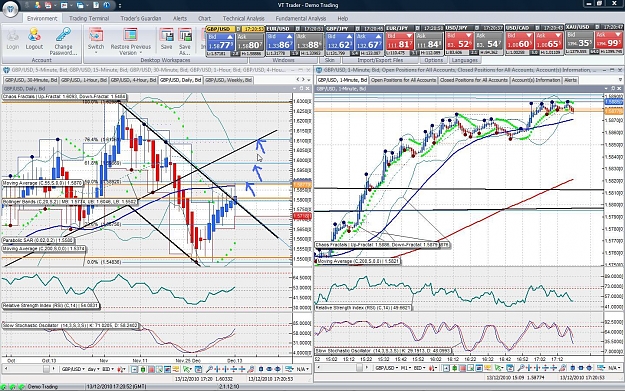
- Ifty replied Dec 13, 2010
Hi Guys, a little bored so wanted to show you something. No indicator in the world is 100% guaranteed but still wanted to show you a little on the parabolic sar on the 1H to see if it can help anyone (although I am a beginner myself and no expert ...
Cable Update (GBPUSD)
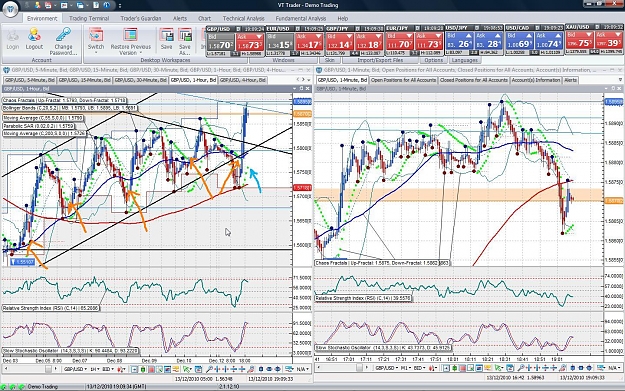
- Ifty replied Dec 13, 2010
Looking at the daily chart it seems to have enough strength to maybe reach the 61.8% at 1.5986? The 50% is at 1.5892 so needs to break that area first though. Then there's the 76.4% / trendline. Anyway just trying to paint a bigger picture for the ...
Cable Update (GBPUSD)