- Search Forex Factory
- 22 Results
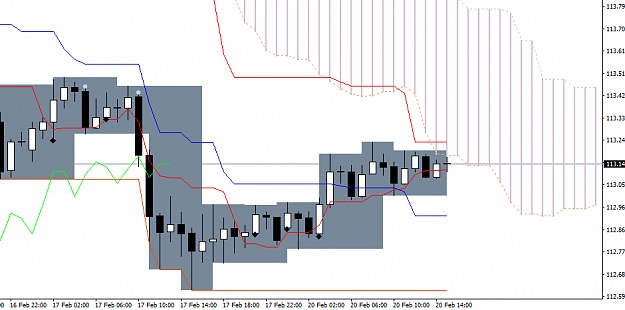
- wiseambition replied Feb 20, 2017
I can't see there being a lot of action today (Monday) with US Presidents Day holiday, on the other hand we should expect the unexpected H1 Ichimoku shows strong recovery since Friday afternoon but it has a thick cloud above current price action
USD/JPY Discussion
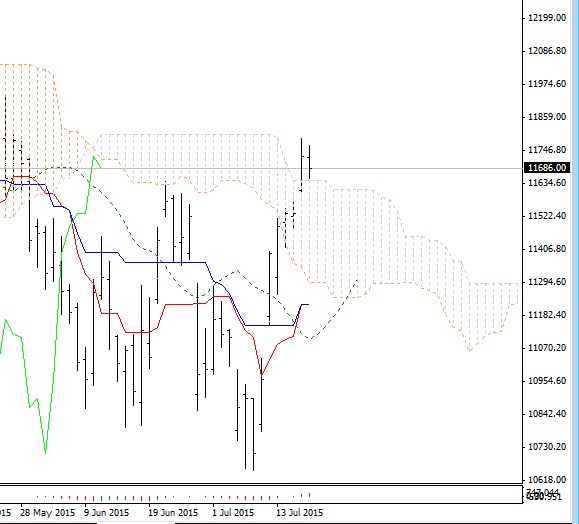
- wiseambition replied Jul 18, 2015
D1 Ger30 on Ichimoku has just broken up through cloud in the last couple trading days. I have not seen this happen since maybe November 2014 Tenkan Sen may also shortly move higher than KS Peak price of 23/June has been surpassed, meaning Chikou ...
Carpe diem: Intraday tactics for Dax and Dow
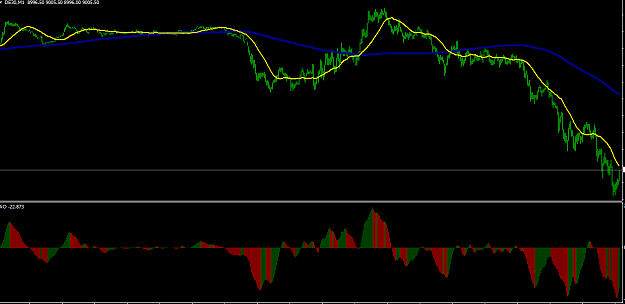
- wiseambition replied Oct 9, 2014
In the main I trade Dax fairly well on m5, using techniques such as fractal breaks (meaning breaks of support and resistance in the moving time frame). Also having regard to Elliott Waves using Awesome Oscillator or e-waves. However one of my ...
Carpe diem: Intraday tactics for Dax and Dow
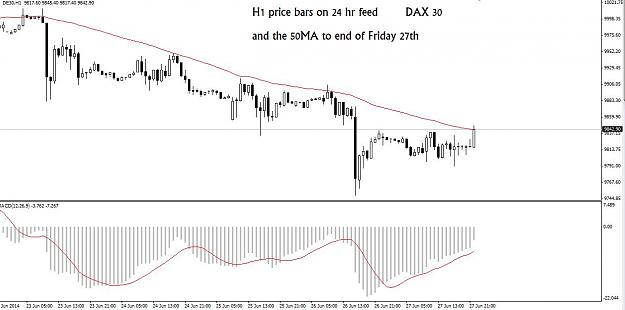
- wiseambition replied Jun 28, 2014
I dont know whether the rise at closing was profit taking nor on small volumes, and I dont know whether it will carry through to next week but I do think the decline on Friday was stalled. the Elliotticians might say there is unfinished business at ...
SPX and DAX - CFDs are the place to be
- wiseambition replied Mar 29, 2014
As to definitions, my understanding of fractals in terms of charts and wave forms is that they are extremes made in the price, high or low, determined if the previous 2 and next 2 candles for the given timeframe are either higher (when price had ...
Cable Update (GBPUSD)
- wiseambition replied Mar 29, 2014
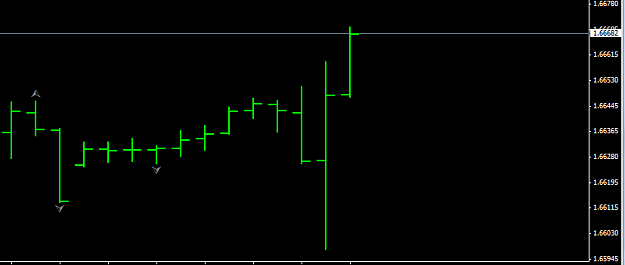
GU H1 Price made a higher high, but bottom of chart is MACD, and there is divergence, the momentum in MACD is decreasing and I would anticipate a trend change, downwards is possible soon
Cable Update (GBPUSD)
- wiseambition replied Feb 25, 2014
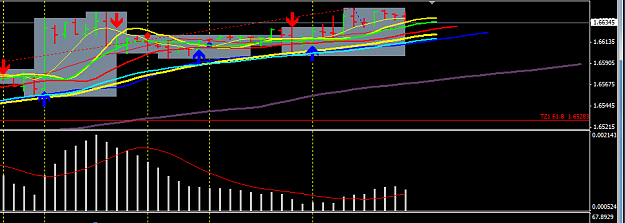
As with THEDDREPORT who put up some interesting charts, my reading of GBPUSD, on H4 is bullish, although when it's going to happen I dont know. The coloured lines on this chart are moving averages from the Bill Williams "Alligator" indicator, and ...
Cable Update (GBPUSD)

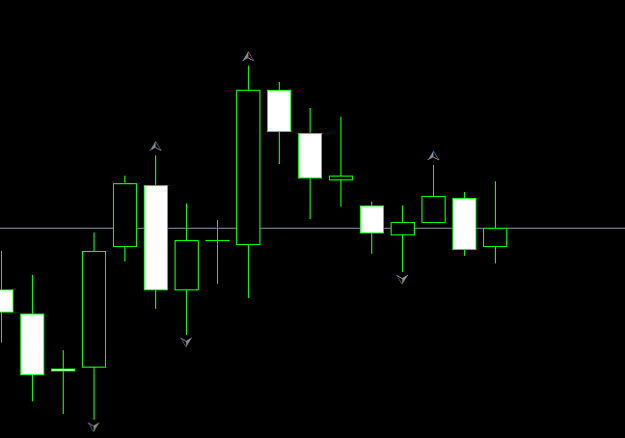
- wiseambition replied Feb 24, 2014
It definitely has the jitters. However I can see with hindsight that the push down in the 0800 candle happened after a drop through support, looking at the H1, and using fractals as the measure of that support. Likewise when the spike was oversold ...
Cable Update (GBPUSD)
- wiseambition replied Feb 22, 2014
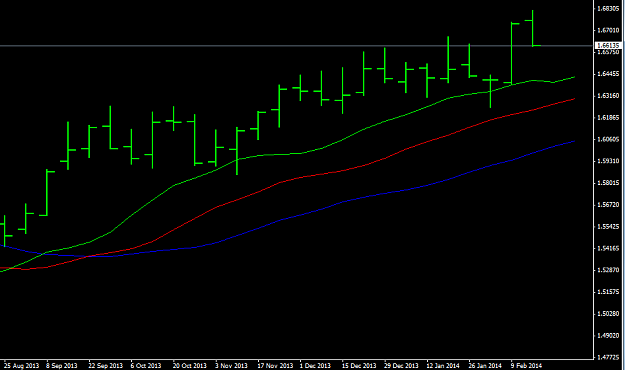
I am just looking at the bigger picture, the weekly chart for the last 6 months. I honestly think in spite of this week ending on a bad note, the upward progress in the bull run is steady, and this one will take a fair bit of turning around. ...
Cable Update (GBPUSD)
- wiseambition replied Dec 13, 2012
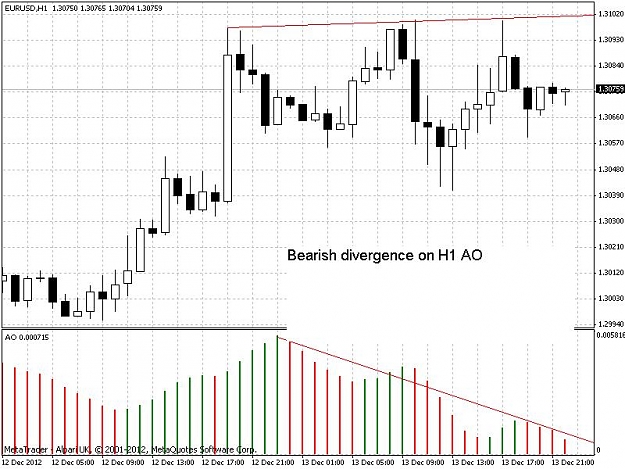
I wonder if this Eurusd is running out of push On H1 chart there's bearish divergence, wave making lower highs relative to price
EURUSD
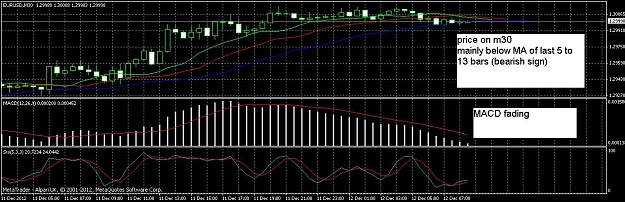
- wiseambition replied Dec 12, 2012
Many of my indicators would actually say go short. The Forex Goiler tool said same last night Not a lot of momentum right now but confused
EURUSD
- wiseambition replied Oct 30, 2012
This is a worrying situation. Not even viagra would help The dollar is nearly as sick today!
EURUSD

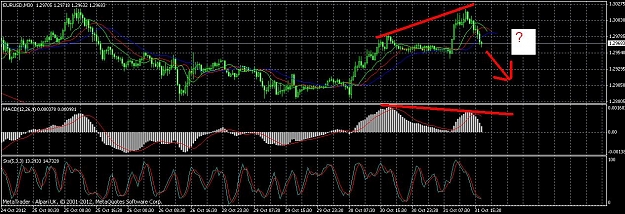
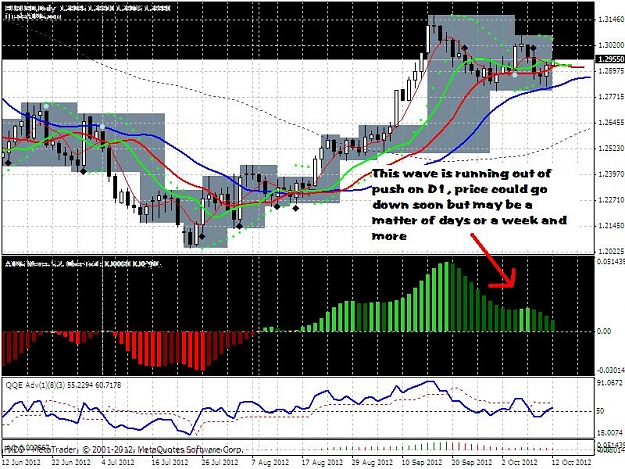
- wiseambition replied Oct 26, 2012
hear hear If indicators such as MACD, Awesome Oscillator, QQE (RSI) are anything to go by they all point downards
EurAnalysis
- wiseambition replied Oct 21, 2012
my 4hr chart has that bearish look too, but you can find a chart or TF to justify anything, and that's why I find the current situation confusing
EURUSD

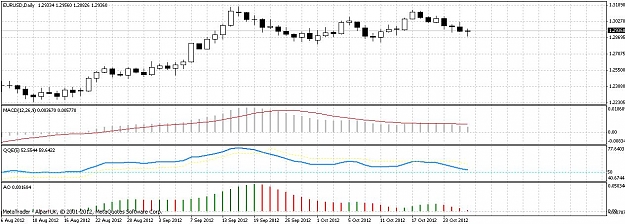
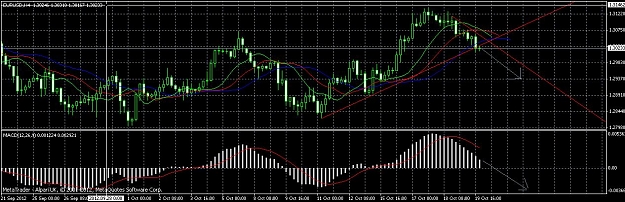
- wiseambition replied Oct 13, 2012
But I wonder how far it will go down, projecting the possibility of a downward crossover of Awesome Oscillator on D1 soon
EURUSD

- wiseambition replied Oct 13, 2012
I dont read much into this, the dying moments of Friday night's trading is influenced by thin volumes and brokers widening their spreads. And some of our mentors would say don't take too much notice of M1 because it is sometimes only a fight between ...
EURUSD
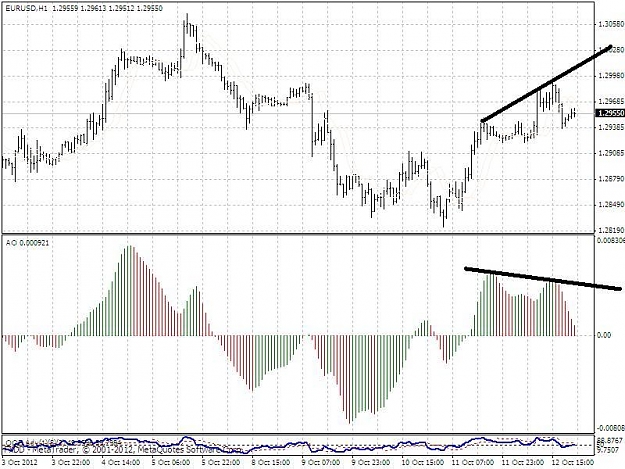
- wiseambition replied Oct 13, 2012
bearish divergence — I plotted H1 Eurusd and Awesome Oscillator to show wave I see a higher high on the price, but a lower peak to the corresponding AO wave To me this means bearish divergence and indicates the possibility of a downward push ...
Trading EURUSD only
