- Search Forex Factory
- 25 Results (1 Thread , 24 Replies )
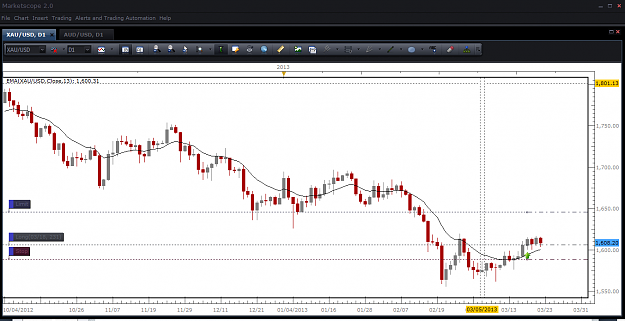
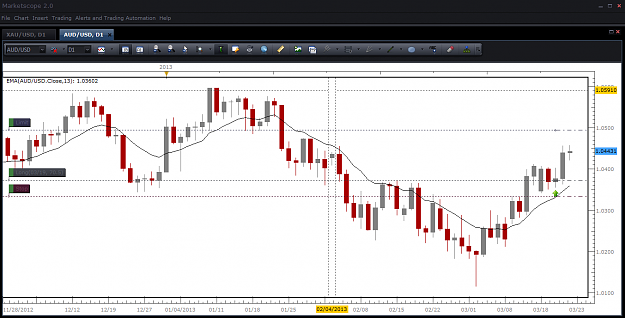
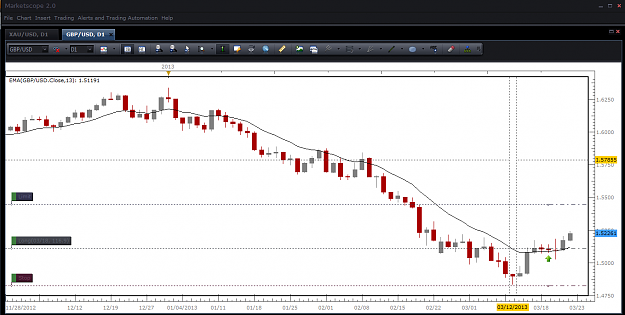
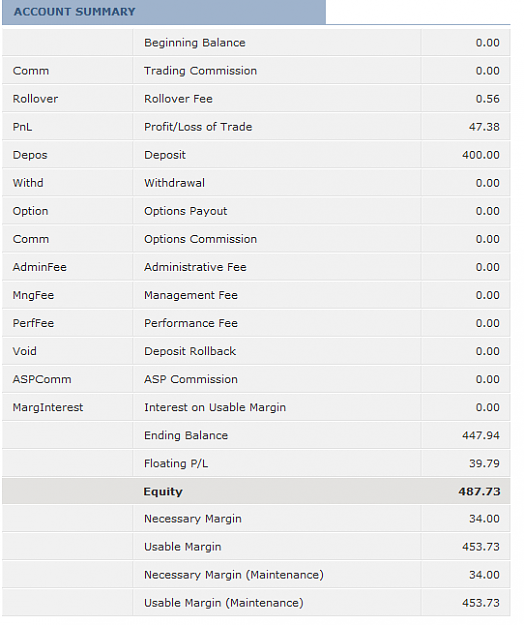
- gino32 replied Mar 25, 2013
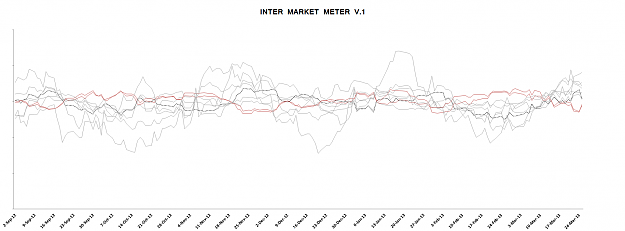
intermarket meter 3.25.2013 image *Closed profit on AUDUSD 4.23 fibo Still open XAUUSD and GBPUSD
EURO Simplex-ts [FREE]
- EURO Simplex-ts [FREE]Started Feb 24, 2013|Commercial Content|11 replies
INTRODUCTION EURO SIMPLEX-TS it’s a FX strategy based on inter market relationships between Metals ...
- gino32 replied Jan 16, 2013
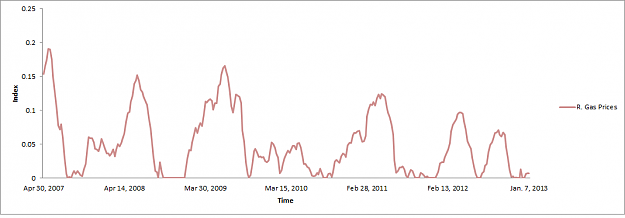
retail gas prices US cycle, inflation indicator last 5 years+-, **all of this affects usdx,euro, etc. Things you should do or at least have, Prices as they are mean nothing, cycles do.
Intermarket Meter+Vix Daily Signal
- gino32 replied Jan 16, 2013
just for the curious ones, this is how inter market meter functioned last 6 months. The message its simple "selective high probability crosses. Nothing more nothing less"
Intermarket Meter+Vix Daily Signal
- gino32 replied Jan 16, 2013
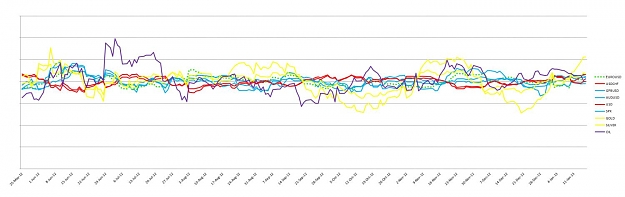
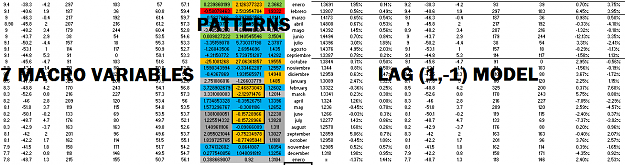
Something like this will be nice to see around, This is a macro indicator, i load N macro fundamental variables (Mostly US) then i use some lagging and other leading, then i just find patterns in the outputs, the colored cells. My point is if you ...
Dukascopy Market and Economic Research
- gino32 replied Jan 15, 2013
Referring to your order flow index, How could you back up the phrase "is because noncommercials tend to be wrong and commercials tend to be right when it comes to picking tops and bottoms. The COT Index data below show the difference between net ...
FXCM/DailyFX Signals and Strategies
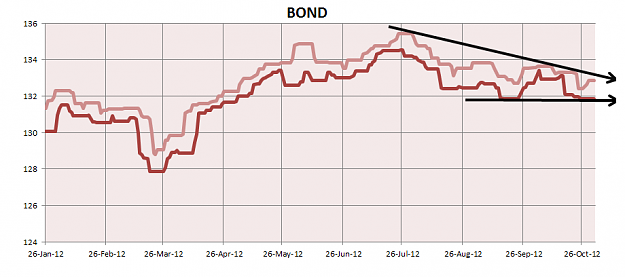
- gino32 replied Nov 1, 2012
Another Key element to watch.. — this is the value of the bonds 10 year. At this moment they are holding on support, a break above the trend line should be bullish to the USD (Bearish for the EURO)... watch this carefully because this could ...
EurAnalysis
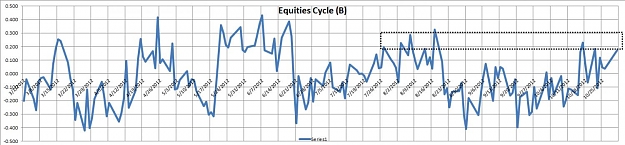
- gino32 replied Oct 31, 2012
my fronts are still bearish, this chart shows the EQUITIES PUTS AND CALLS cycle.(OPTIONS) We are near the previous peak. If this peak play bearish on Equities it could also pull down the euro.
EurAnalysis
- gino32 replied Oct 31, 2012
US Bonds — This might push the eurusd dollar down. (- yield + value on US Bonds) (+ Value on US Bonds + Value on USD). So this could indicate a bearish bias also. This on daily data. Daily candle showing weakness on eurusd.
EURUSD

- gino32 replied Oct 31, 2012
bonds 10year(yield) — This is the chart of the bonds 10 year yield. This chart also suggest a bearish bias on EURUSD. (- yield + value on US Bonds) (+Value on US Bonds +Value on USD)
EurAnalysis
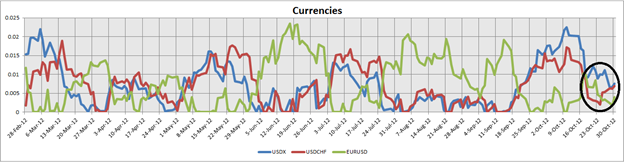
- gino32 replied Oct 31, 2012
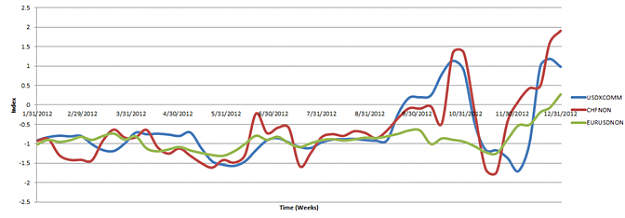
Currency Meter — This is 1 indicator, I made. Its based on a real weighted index. As of real, i mean based con something that has an intrinsic value like gold. When red line and blue line cross up/down green line, there is a bias. yesterday's ...
Strong - Weak Currency Analysis

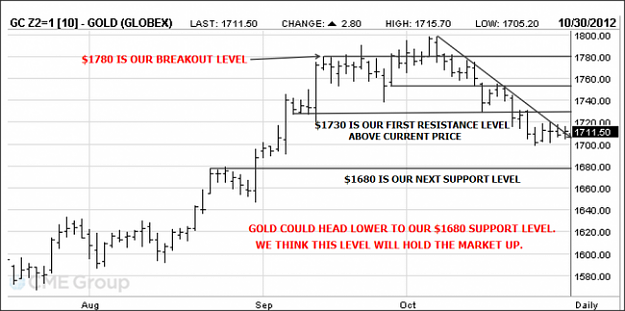
- gino32 replied Oct 30, 2012
additional — Also this could push the euro down this week: Source: url 1680-50 support for me (this because there is a strong relationship + EURO +Commodities (Gold) )
EurAnalysis
- gino32 replied Aug 9, 2012
waiting for this spot to go long! anyone also looking for this?
EURUSD maybe london or ny for entry?
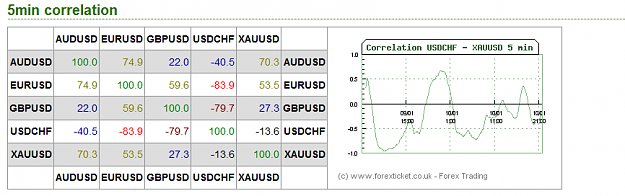
- gino32 replied Jan 10, 2012
correlation table: Blue: Correlation is low but you can make some profit Red: Negative Correlation Green: + Correlation
Cable Update (GBPUSD)
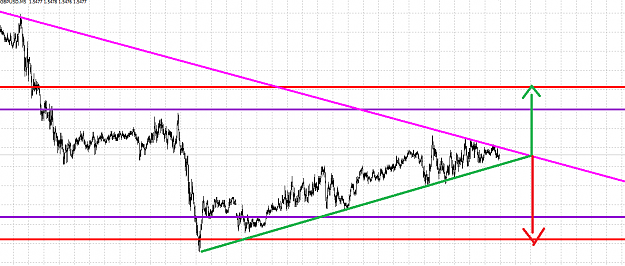
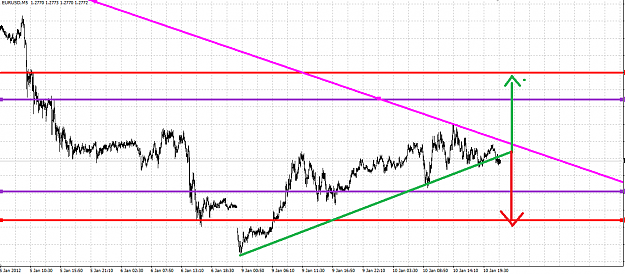
- gino32 replied Jan 10, 2012
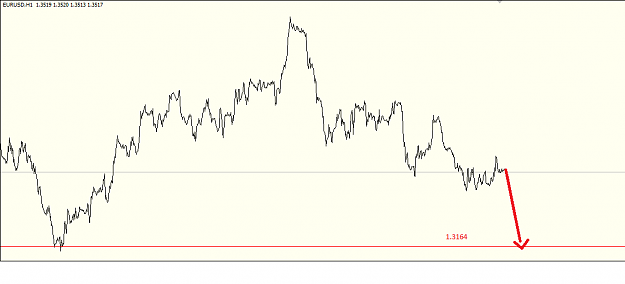
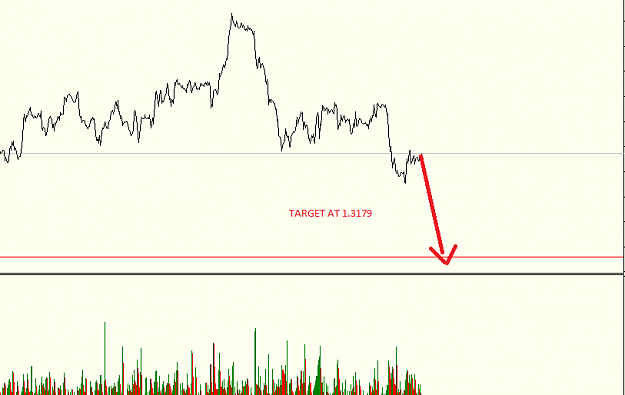
hey guys, posting a trading idea here, so Red lines: Targets Purple lines: SL 1st possible scenario: Breaks down, continue til TP: 1.2703 SL: 1.2843 2nd possible scenario: Breaks up, continue til TP: 1.2875 SL: 1.2737 TF: 5M Possible Bias: Bearish, ...
EURUSD
- gino32 replied Jan 10, 2012
hey guys, i'll be posting some trading ideas using Supply and Demand concept, for me is the best way of trading so, Red lines: Targets Purple Lines: Stop Loss 1st possible scenario: Break down, and continue until lower red line SL:1.5524 TP:1.5389 ...
Cable Update (GBPUSD)