- Search Forex Factory
- 29 Results
-
 Master_kiwa replied Oct 31, 2014
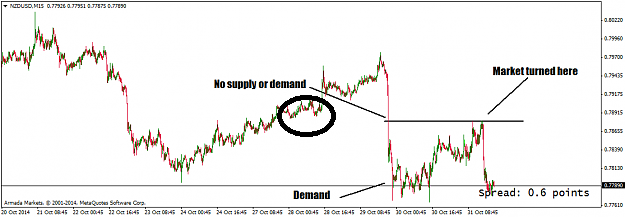
Hello Fxyogi.... pLEASE have a look again at that NZD-USD chart which you posted. It clearly rejected off of a supply and demand area... Look to the left of that big spike down. You can clearly see the accumulation zone.. image
ReadtheMarket - Supply and Demand with Price Action
- Master_kiwa replied Oct 29, 2014
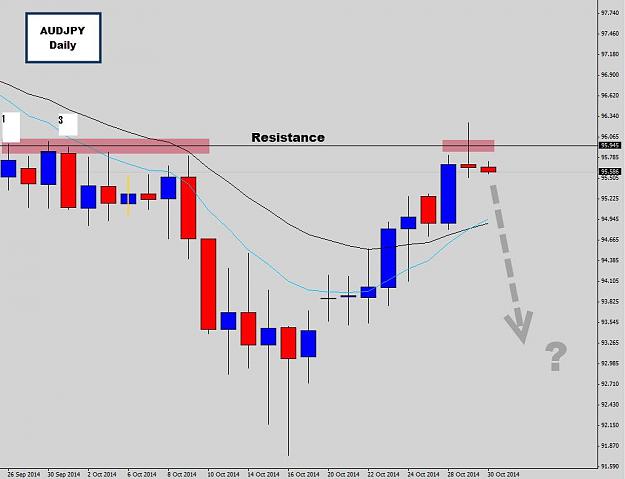
I have copied the same chart which you have used and I have labled it with numbers. You can see that candle number one is the first candle to touch what you would of considered the resistance line. Since the assumed trend on the daily chart is down, ...
Simple, Powerful and Effective Price Action Trading Strategies
- Master_kiwa replied Oct 29, 2014
One of the sad realities of supply and demand trading is that isn't at all accurate. There honestly isn't any science to drawing the boxes in the zone. The science is how do you determine to buy or sell once you are in, or once you have drawn the ...
ReadtheMarket - Supply and Demand with Price Action
- Master_kiwa replied Oct 29, 2014
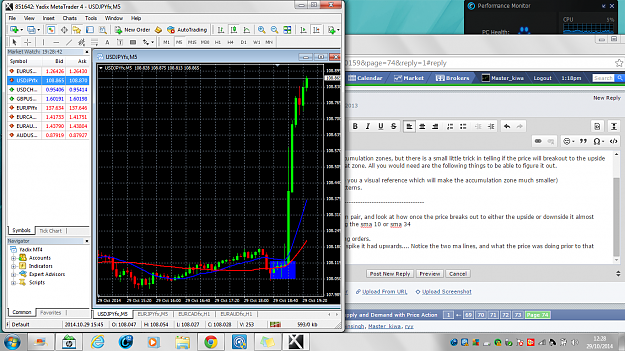
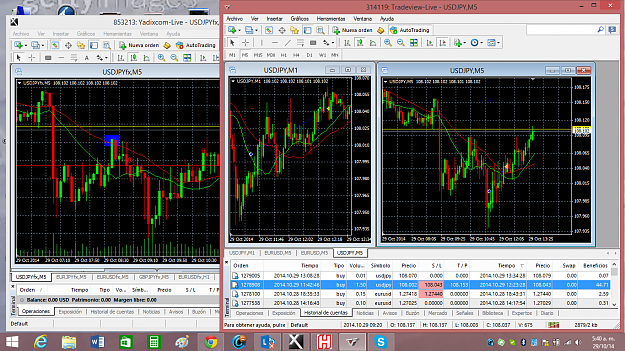
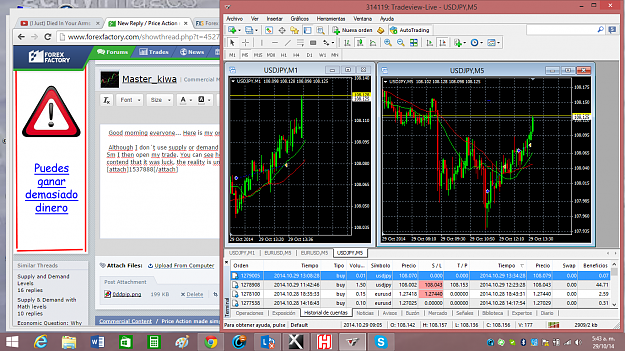
Good morning everyone... Here is my only scalp of the day (That trade is also posted on my trade explorer) Although I don´t use supply or demand zones, I do use MA lines, and based on the patters formed inside those lines on the 1m compared to 5m I ...
Price Action made simple with Supply and Demand levels
- Master_kiwa replied Sep 25, 2014
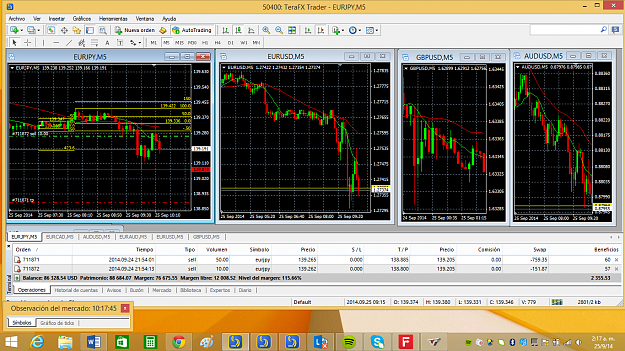
My trade right now on EJ... Big enough? image
Are there any Large Lot Traders here?
- Master_kiwa replied Sep 25, 2014
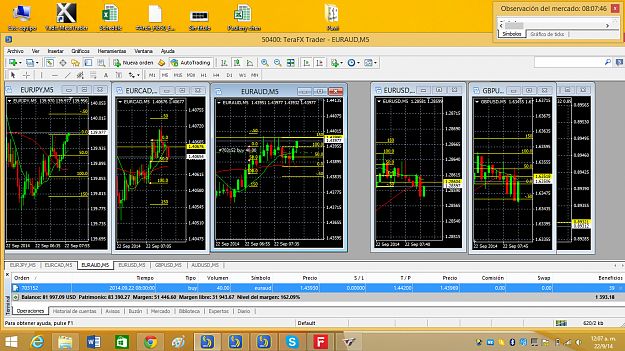
Would this lot size be big enough for you? image image
Are there any Large Lot Traders here?
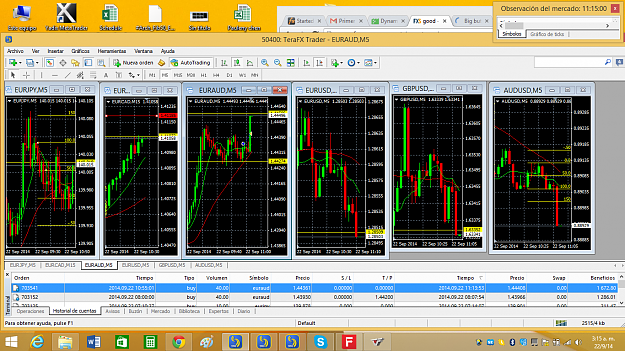
- Master_kiwa replied Dec 3, 2013
How did everyone fair today with the EUR/USD? I spent most of my day awaiting a certain formation, which i ended up shorting. I then got out way to early.
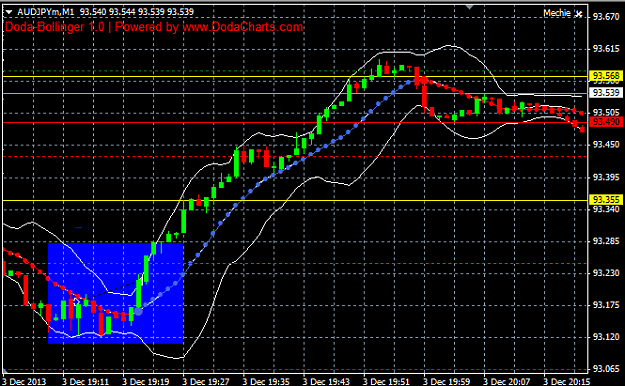
EURUSD I even entered in the AJ long (the move about an hour ago when it went from 93.13 to 93.63 ...
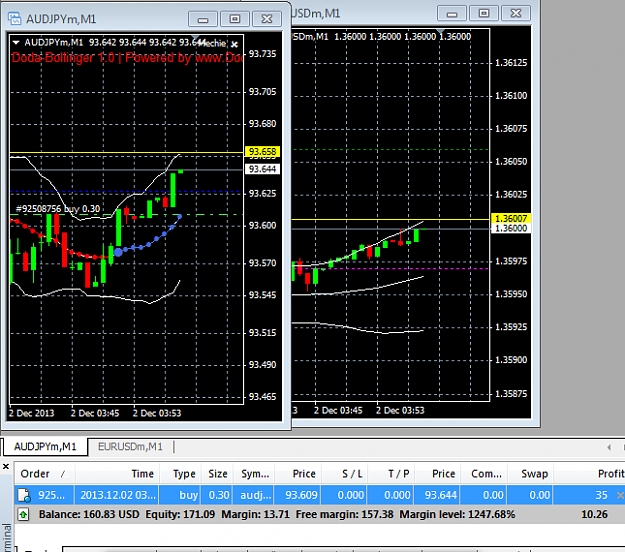
- Master_kiwa replied Dec 2, 2013
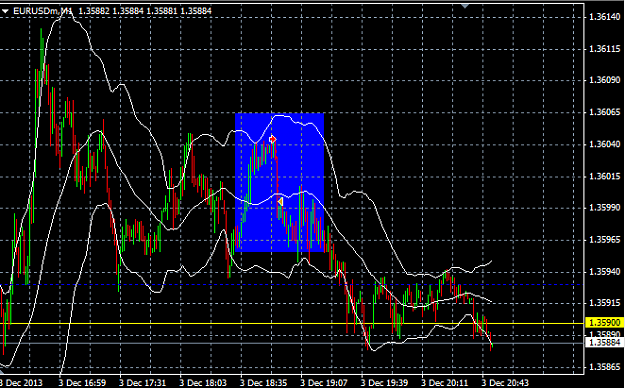
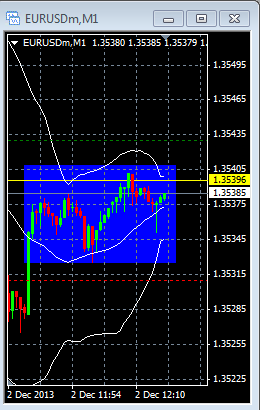
Here is the accumulation I was speaking about before. Notice how after closed over the ma 34 (the middle line) the price has gone flat.
EURUSD
- Master_kiwa replied Dec 2, 2013
I have closed the longs. It has just touched the MA 34 level. I expect accumulation now. So will recalculate once the accumulation is confirmed.
EURUSD
- Master_kiwa replied Dec 2, 2013
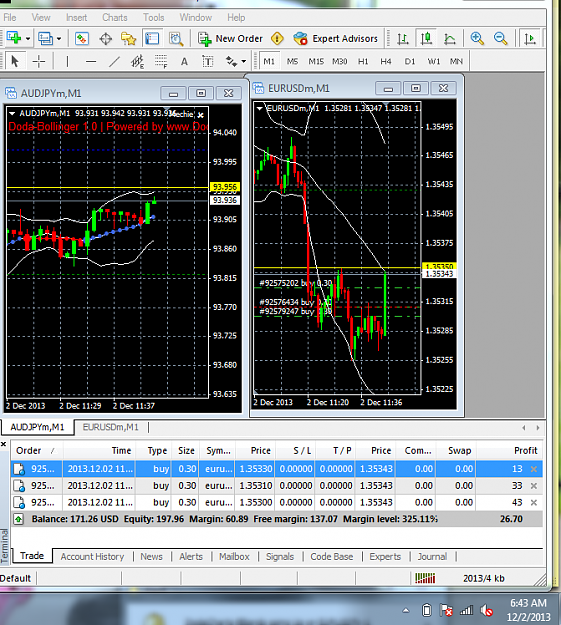
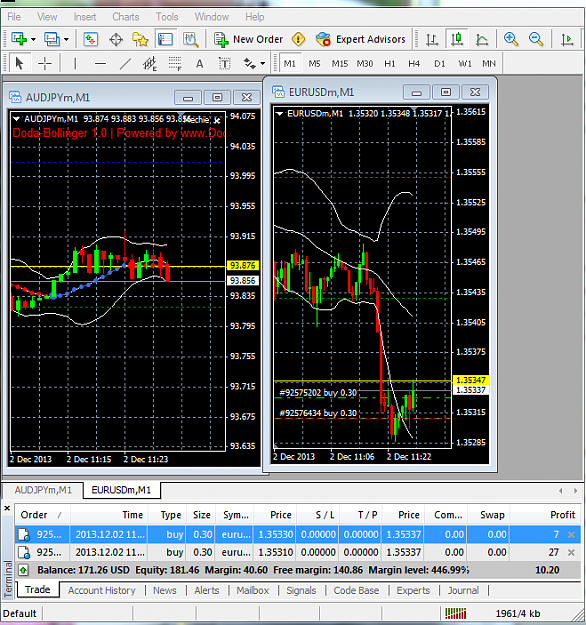
Im long EU. Playing what I assume to be a pivot bounce. A close under the low created from the drop and I see 1.3480 before US market opens.
EURUSD
- Master_kiwa replied Dec 2, 2013
It is when the market in in a range. E/U isn't in a range at the current moment, but is setting up to being one at this time.
EURUSD

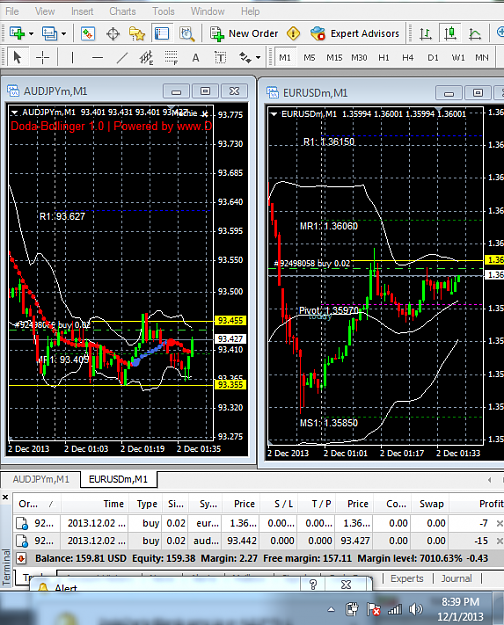
- Master_kiwa replied Dec 1, 2013
Once AJ and EU start to correlate on the 1m, I follow AJ based on the direction of EU.
EURUSD
- Master_kiwa replied Dec 1, 2013
Everything closed. I will quit now, and wait for london. The pivots are very close to one another, and mondays are typically small ranged sessions.
EURUSD
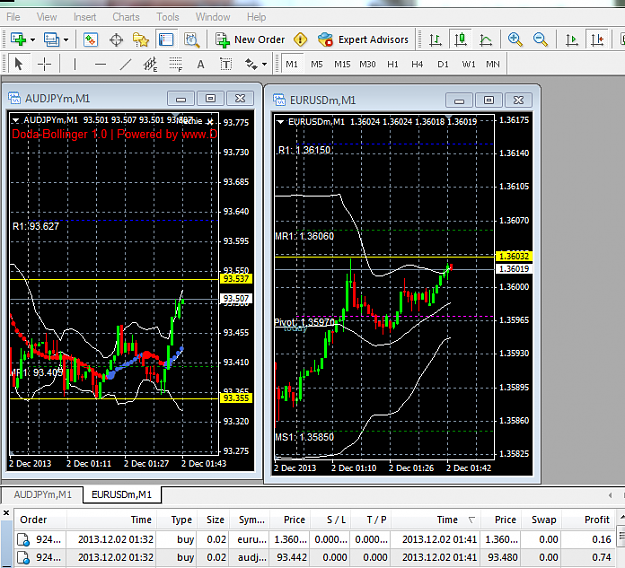
- Master_kiwa replied Dec 1, 2013
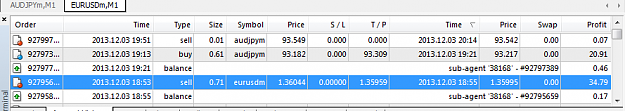
As you can see I am long on eu and AJ.... Green on both at the current moment.
EURUSD
- Master_kiwa replied Nov 28, 2013
Does that appear to be a martingale system to you?
Does the martingale system really work?
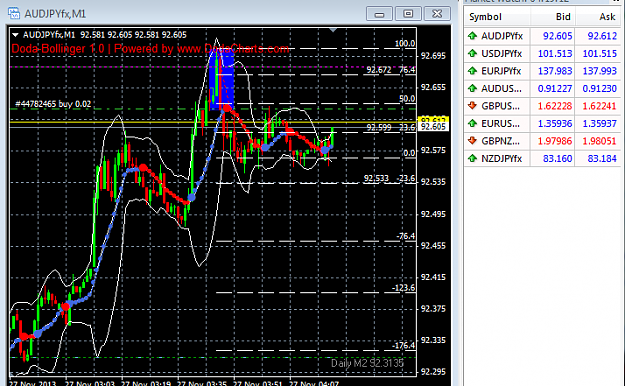
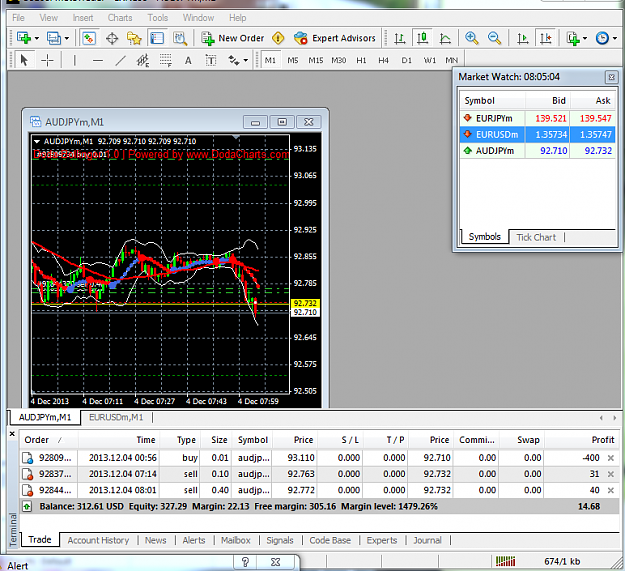
- Master_kiwa replied Nov 27, 2013
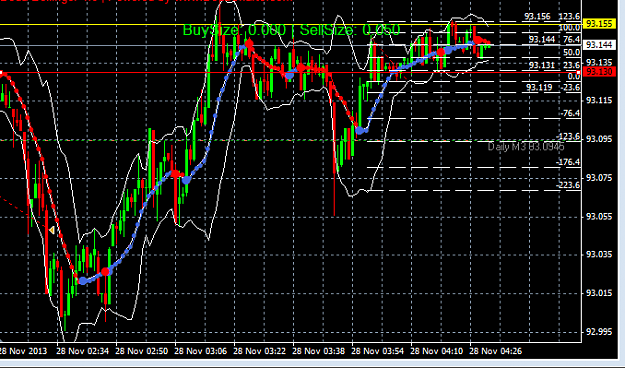
Hello. The current bid price on AJ is 93.145 Once the price closes under 93.13 on the 1m chart I would recommend selling for a major pullback. Until hold the long, or wait for the short.
AUD/JPY
- Master_kiwa replied Nov 27, 2013
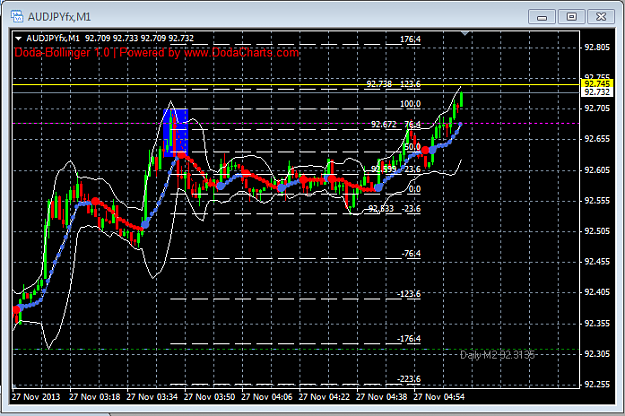
Still moving to the upside.
Does the martingale system really work?
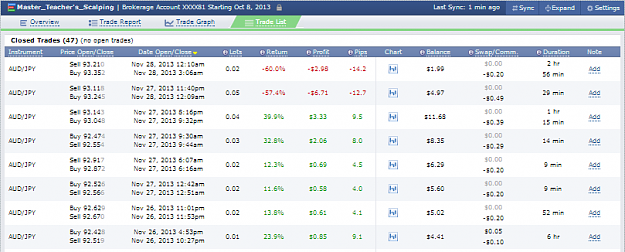
- Master_kiwa replied Nov 26, 2013
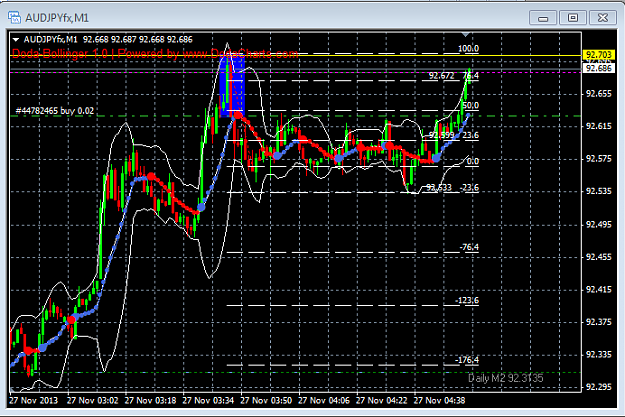
You can see that the price has yet to close under my stop loss price. The .02 buy is still open, and I have yet to place a binary trade. Based on the current formation, AJ is appearing to be heading into an accumulation formation. How can one tell ...
Does the martingale system really work?