- Search Forex Factory
- 458 Results (6 Threads , 452 Replies )
-
 stevefx replied May 14, 2020
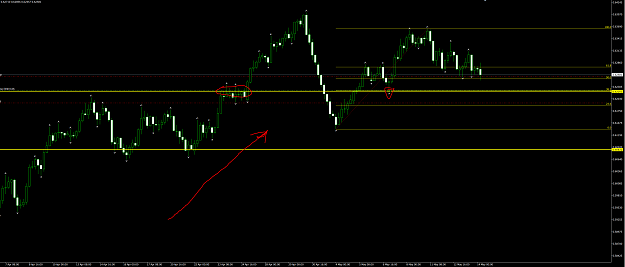
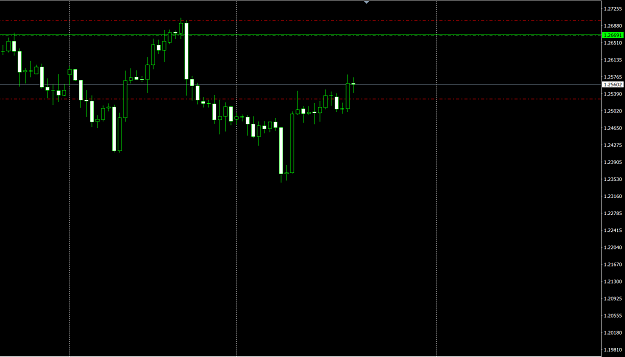
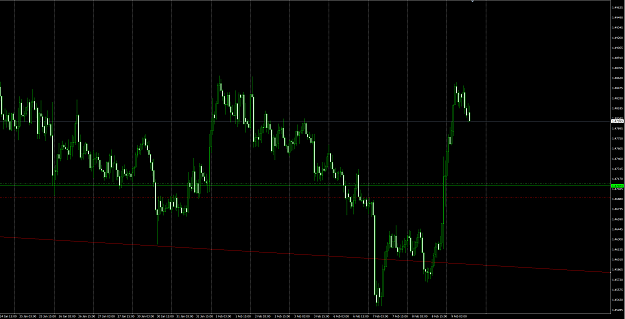
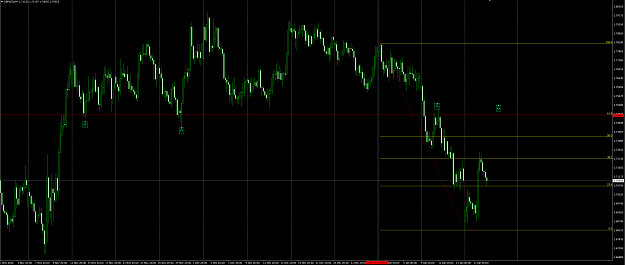
ok took less than half a percent loss on EJ trade. Not really a thing, just that I'm a bit frustrated because I knew that it was sub par. Another pending on GBP/Aud, short. Its in trend with a distinct touch on S/R which broke the low. Thats the ...
Simple Confluence TJ
- stevefx replied May 13, 2020
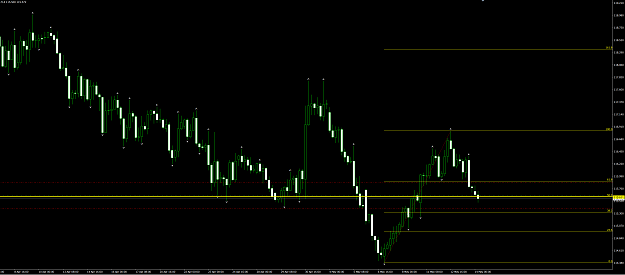
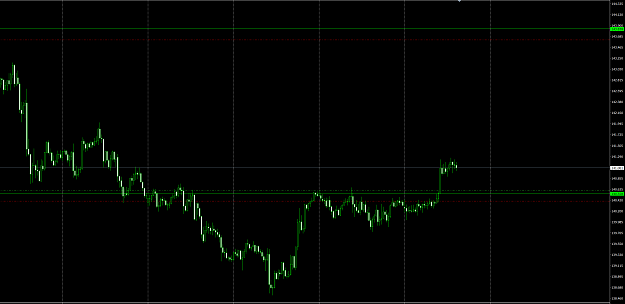
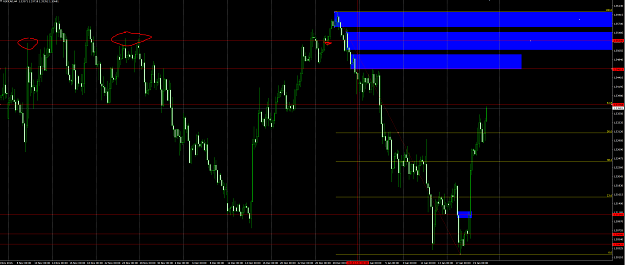
Here's a pending long on AudChf. I'd take this any day of the week and twice on Sunday. Hope it fills.
Simple Confluence TJ
- stevefx replied May 13, 2020
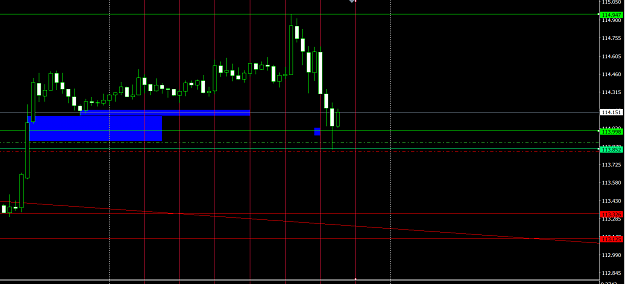
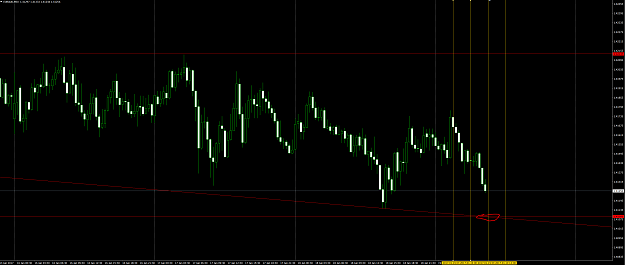
So here for my first posted entry is this long on EJ which is on the low end of what I'd trade. Problems are that its heavily countertrend and the SR is not as precise as I'd like it to be. I might be dogged on it but maybe not we'll see. My risk on ...
Simple Confluence TJ
- stevefx replied May 14, 2019
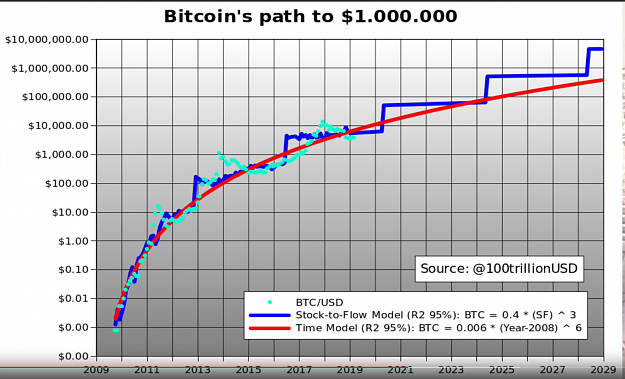
Anyway here's one price model illustrating Stock to Flow..Source is named on the chart. And some further reading on the subject from Forbe's which gives a pretty balanced view of the matter. url
The rise of CRYPTO - Bitcoin, LTC, Ether, Dash, Monero
- stevefx replied May 12, 2019
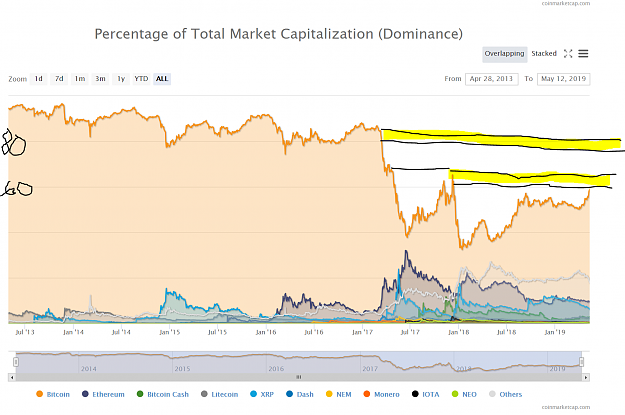
I like where your head is at. BTC could face some resistance on dominance chart versus alts. I've always been partial to Neo - its in bargain basement territory. Makes Gas and nice tech..
The rise of CRYPTO - Bitcoin, LTC, Ether, Dash, Monero
- stevefx replied Dec 18, 2018
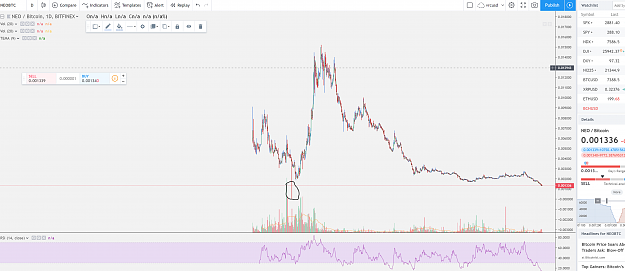
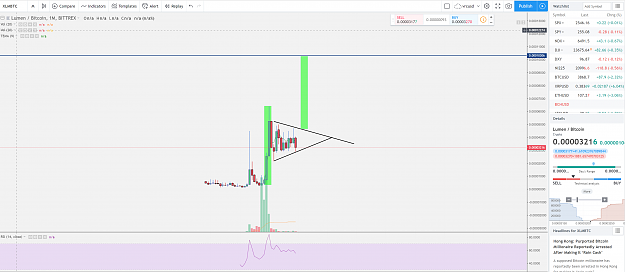
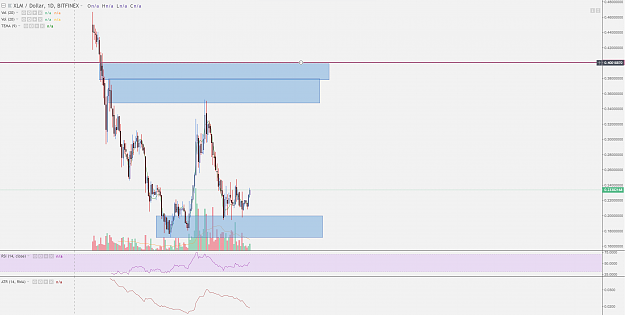
XLM might be a flag.
The rise of CRYPTO - Bitcoin, LTC, Ether, Dash, Monero
- stevefx replied Dec 15, 2018
Just bored so I'll share some thoughts about it. Generally the future of crypto seems to be tied to so many abstractions-the Greater Fool theory is another, probably not important one. Important abstractions might be: the preeminence of Bitcoin in a ...
The rise of CRYPTO - Bitcoin, LTC, Ether, Dash, Monero
- stevefx replied Sep 9, 2018
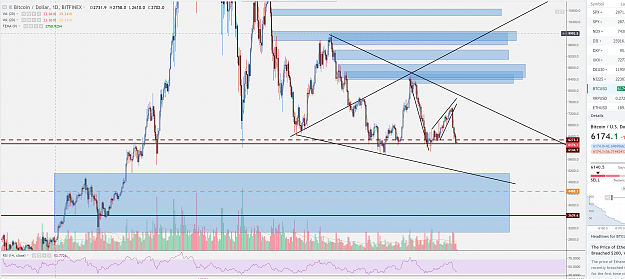
I'd say momentum is with the bears now. Price is leaning on the neckline of this H&S at 6150 and really has already verified something close enough to a good bearish pennant which should target 4500. That said, there is a greater bullish wolf wave ...
The rise of CRYPTO - Bitcoin, LTC, Ether, Dash, Monero
- stevefx replied Jan 20, 2017
Well where price is now, just at your A line, or bottom of A top of C, is a fibber. Looking left it doesn't seem to be enough to stop this particular train. Ucad is playing in some wide harmonics and the levels in this range don't seem well formed ...
One Level
- stevefx replied Jan 19, 2017
Looking at this confluence on EA, monthly support + LTL. 4108. I know you don't like EA, sorry its all I got.
One Level
- stevefx replied Jan 18, 2017
This isn't a bad look on GZ at 1.7746. 61.8 + SR, if it can get there.
One Level
- stevefx replied Jan 17, 2017
Your a really good trader. Respect. Eur/Aud trying some longs around 4135.
One Level
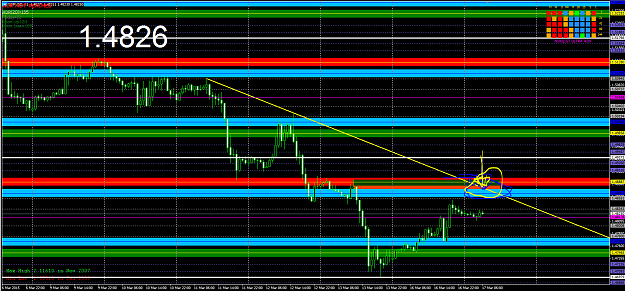
- stevefx replied Mar 17, 2015
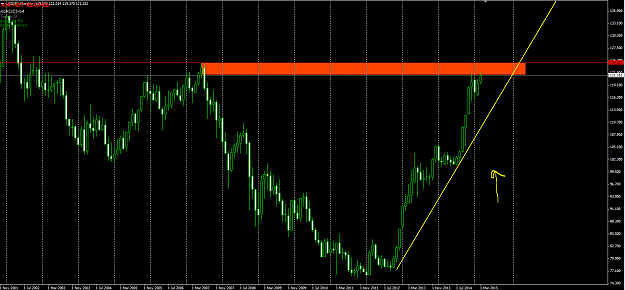
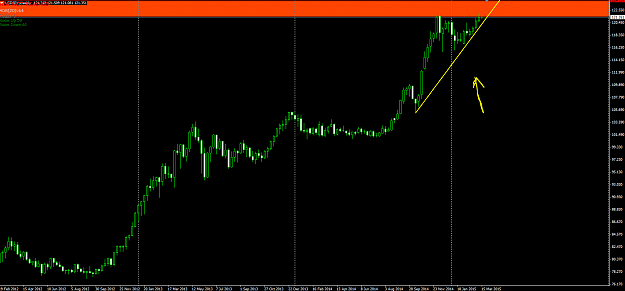
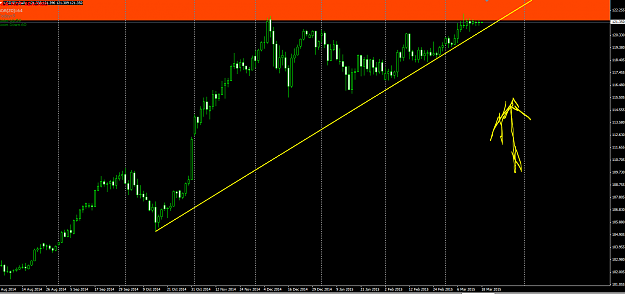
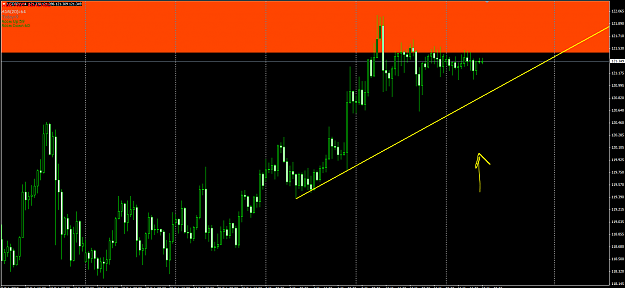
Here's a detailed trendline analysis of UJ from the Monthly down the H4. The monthly chart also shows the Supply Zone I just mentioned.
Happs Trading System
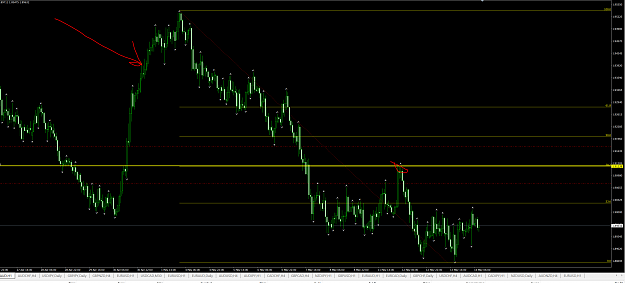
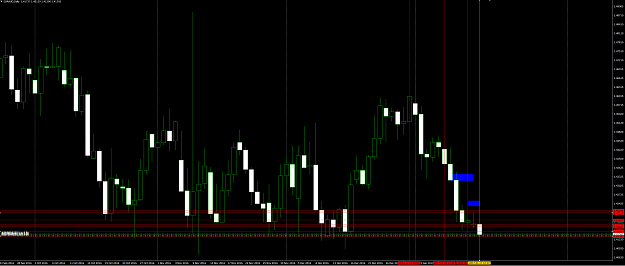
- stevefx replied Mar 17, 2015
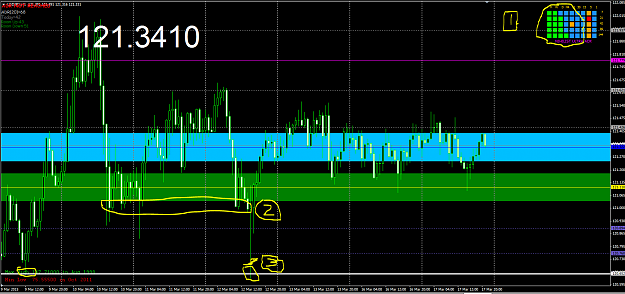
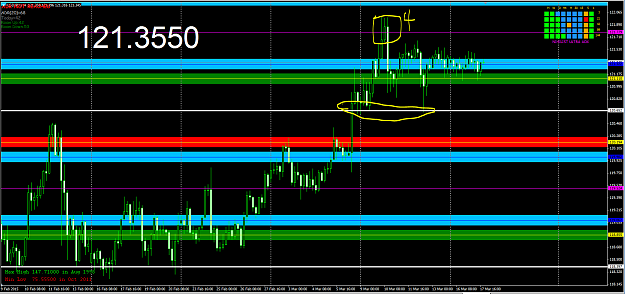
I haven't been following UJ that closely but I will give you my impressions of your ideas and the UJ pair. Following the numbers I posted on the charts below: 1) You must realize that you are considering selling the pair in a strong bullish trend ...
Happs Trading System
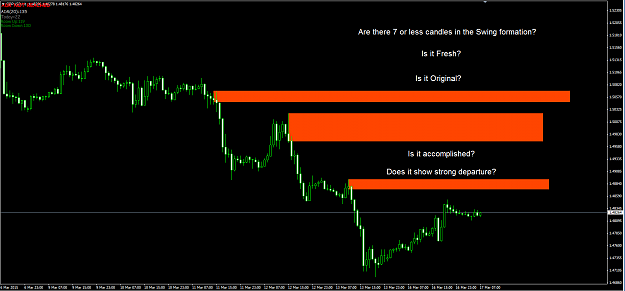
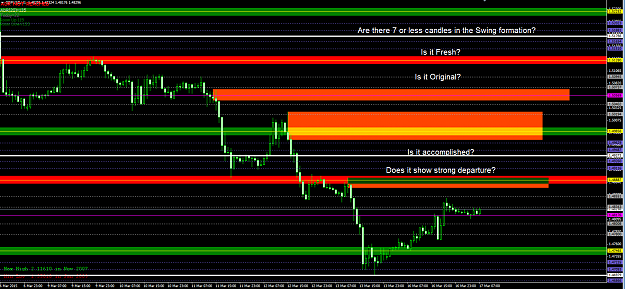
- stevefx replied Mar 17, 2015
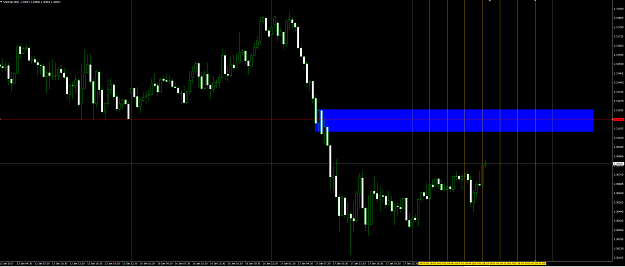
One way to evaluate Happs levels is to first evaluate the levels by themselves in a standard Supply and Demand fashion. Here are some basic criterion for determining if a Supply or Demand level is a good one to trade off of: 1)Are there 7 or less ...
Happs Trading System