- Search Forex Factory
- 135 Results (7 Threads , 128 Replies )
- bumasoft replied Jan 21, 2013
image Hope this clears things up a bit. Let me know if you have questions or something is not clear in the screenshot.
- bumasoft replied Jan 20, 2013
Example of corelation use I mentioned corelation a while ago as a means of improving odds. Here is a H8 (8 hours) chart of the US Dollar Index over the last 40 days. We're at demand, low on the curve, with good odds of price going up to 80.50. There ...
- bumasoft replied Jan 15, 2013
How to identify core residual energy (potential supply/demand) on a price chart Sometimes, these consolidation areas will be too wide, making the risk too big for us if we entered a trade while placing our stop on the other side of the area. This ...
- bumasoft replied Jan 14, 2013
Disecting residual energy on a price chart Now it's time for the dirty business! The first step to making use of the principles we just discussed is to figure out how to spot residual energy on a price chart. Here are a few ideas: 1. High residual ...
- bumasoft replied Jan 14, 2013
A simple shift in perspective image If you take a long position, you're a bull. If you take a short position, you're a bear. That's common knowledge for traders. And it's kinda' wrong! Let me explain. If Trader A is LONG the EURUSD, what is he now ...
- bumasoft replied Jan 14, 2013
Order flow 101 Let's look at the behaviour of traders and how the order flow shapes the markets. Let's say the iPhone 5 is perceived as being expensive above the price of 500$ and cheap below 300$. The current price is 450$. The people perceiving ...
- bumasoft replied Jan 14, 2013
The two energies There are two factors, forces or energies (whatever you want to call them) driving prices in any given market. Let's talk about them, one by one: A. Residual energy If you play with a piece of iron and a few magnets frequently, ...
- bumasoft replied Jan 14, 2013
Why does price move up, down or sideways? What you see on your charts is simply a picture of all the FILLED orders. The market is nothing else but the dynamic of buy versus sell orders, the flow of supply and demand. What is supply and demand? ...
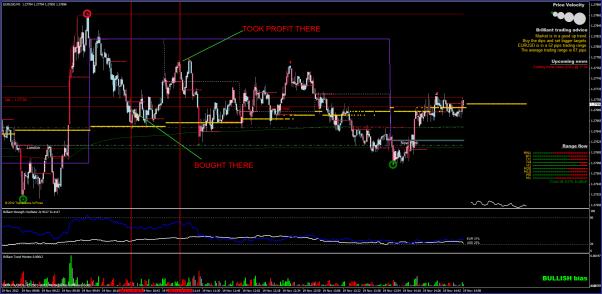
- BumaSoft's Market Model - Free information on my core trading method
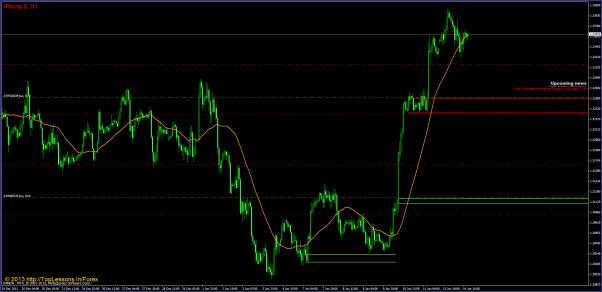
{image} This thread is going to be about my understanding of how the markets work. It will be a ...
- bumasoft replied Dec 13, 2012
Free risk management tool just released on my website (click here to read more and download). It's an MT4 script allowing you to calculate lot size so that you risk a fixed dollar amount per each trade. This is one of the good ways to manage your ...
- Top Lessons in Forex Offers
I am offering a few discounts ahead of Holidays. Starting right now and ending January 1st, 2013, I ...
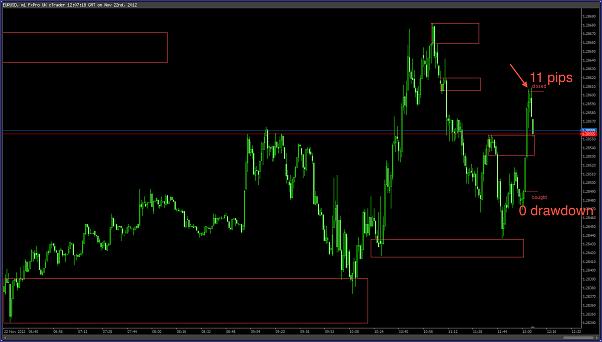
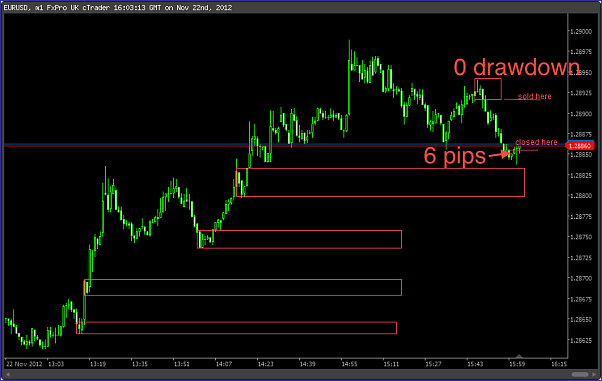
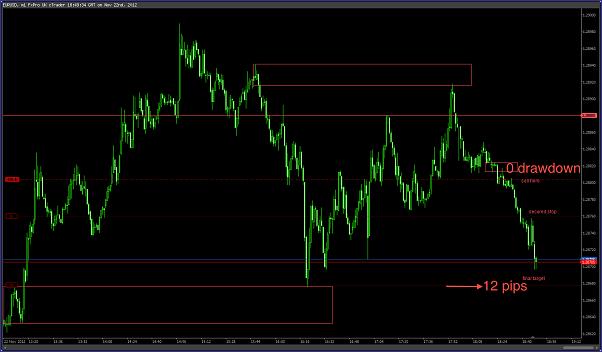
- bumasoft replied Nov 26, 2012
pt49, 1. no manual trading system is profitable unless the trader consistently follows the rules and has mastery over himself, which is why I never bragged about percentage gains in here. 2. the way I trade is my personal style, a discretionary ...
- bumasoft replied Nov 23, 2012
When we begin trading, it's very easy to lose. But who likes easy stuff? We need to be challenged, so that we can be proud of our achievements. So, the ultimate goal of the professional loser should be to make it harder and harder for himself to ...
- How to lose money in the Forex market
Hi, traders, This is the thread where we focus on what makes us lose in the markets. If you just do ...
- bumasoft replied Nov 22, 2012
High probability trading: read more about it here image image image Also, it's Black Friday today, so here's the deal. When you sign up for a free account at the Top Lessons in Forex site, you're elligible to win a one week daily 1/1 coaching ...
- bumasoft replied Nov 19, 2012
Not much action on the EURO today. I only took a scalp long for 9 pips. We're at an H1 resistance level, but it had quite a few touches, so it will probably break today or tomorrow. Only one major news release today in approximately 35 minutes, so ...
- bumasoft replied Nov 16, 2012
Hi, traders, Another week has passed. I'm pleased to announce that Brilliant Charts is at the third revision already, after just one month since the release. We've made a series of important tweaks and additions and the current users are enjoying ...
- bumasoft replied Nov 13, 2012
Hi again, Here's a cool EURUSD daily template you can use to see where the major areas of supply and demand are for this currency pair, based on market geometry. It's attached to this post. Enjoy! image file
- bumasoft replied Nov 6, 2012
Upside? — image Our Nostradamus Forecast seems to be pointing to a bigger retracement to the upside on the EURUSD. We are also at a significant Daily support level (1.2750 - 1.2760). Take caution with your trading today, as we have the US ...
- bumasoft replied Nov 5, 2012
Significant updates — Just released some significant updates to the Brilliant Charts users. More information on the Top Lessons website. image