- Search Forex Factory
- 121 Results
-
 olivierforex replied Jan 13, 2013
Cheers Wiz & likewise. Re one of your previous post: url I'm sure many will have learnt a lot from it so thanks for all your explanations/details. I'm just going to add a little something regarding Money Management combined with Risk/Reward when ...
Genesis Matrix Trading
- olivierforex replied Jan 1, 2013
EU H4 Strategy Weekly Update: Start: http://www.forexfactory.com/showthre...10#post6253310 Updates: http://www.forexfactory.com/showthre...47#post6275247 url url As expected: on the higher TF the moves are almost near their end once Genesis ...
Genesis Matrix Trading
- olivierforex replied Dec 24, 2012
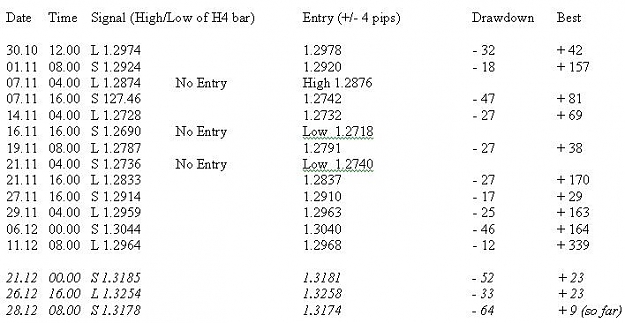
Last trade showed a 'best' of +339 pips, the highest total so far (work on "along the way TPs" is definately needed now, hopefully I'll find time over the Xmas period - best wishes to all, by the way). One new trade this week: I'll take the data on ...
Genesis Matrix Trading
- olivierforex replied Dec 16, 2012
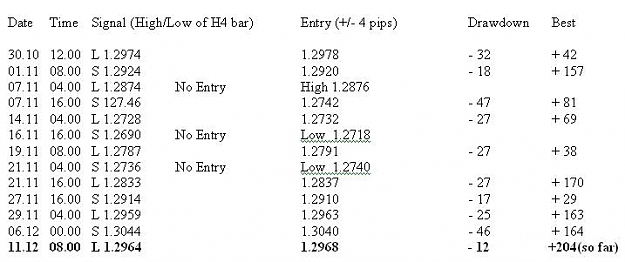
EU H4 Strategy Weekly Update: See url (Start) url (Update 1) Only one trade again this week, Long from 1.2964 and currently with a 'Best' of +204. Notes: .it's good to see that the previous mathematical 'bests' (3049 & 3125 areas) did provide ...
Genesis Matrix Trading
- olivierforex replied Dec 14, 2012
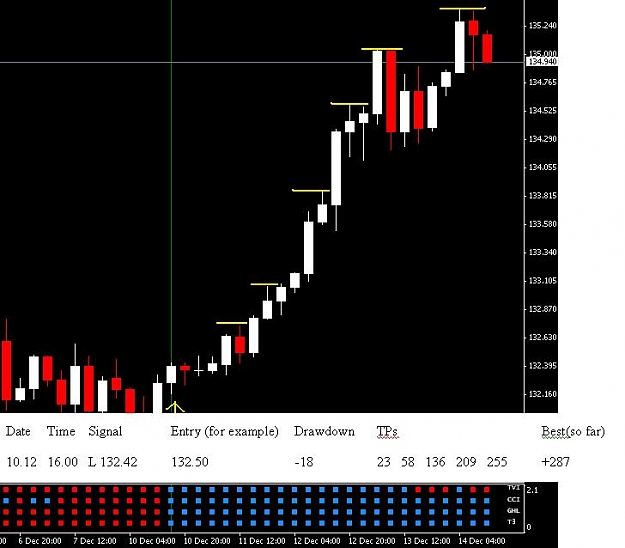
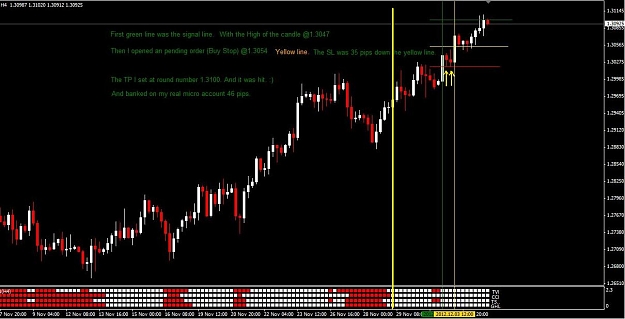
Hi again Ta Hui, This is what I mean about "various TPs along the way"
Genesis Matrix Trading
- olivierforex replied Dec 13, 2012
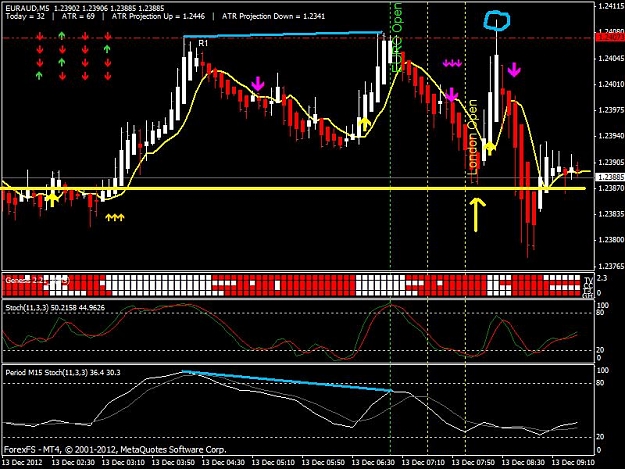
Hi Choppy & welcome, I can't see anything wrong with your entry apart from the fact that looking at the last 24 hours we were still clearly in an uptrend but on top of your reasons you also had negative M15 Stox divergence, so there was a good case ...
Genesis Matrix Trading
- olivierforex replied Dec 11, 2012
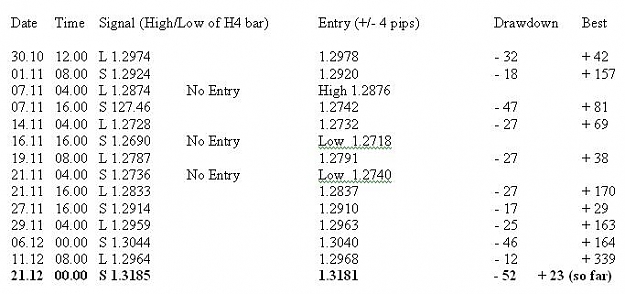
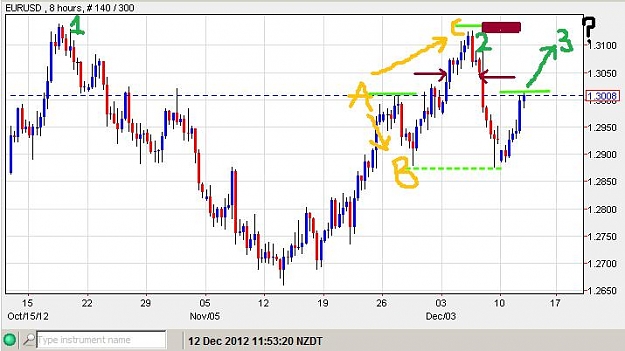
There might not be much in it as I still don't have a huge amount of stats for the H4 strategy, but EU turned long above 2968 and is currently showing a best of +46; next 'mathematical' TPs are +69 (3037) & +81 (3049) and interestingly that ...
Genesis Matrix Trading
- olivierforex replied Dec 9, 2012
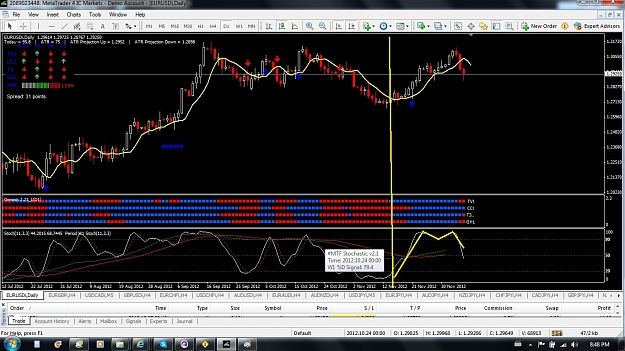
They are both fine: when you switch to the Daily chart, the daily stox is now the red/white (it was red/green on H4) and the weekly stox is now the red/green. I've drawn yellow lines to show the same time actually elapsed on both charts and you can ...
Genesis Matrix Trading
- olivierforex replied Dec 8, 2012
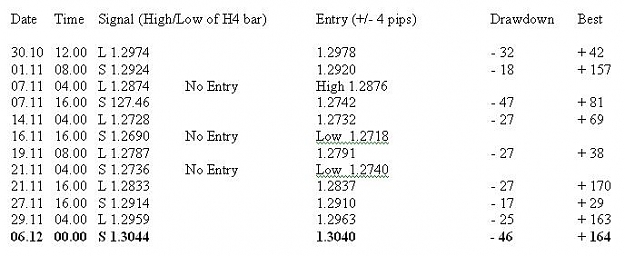
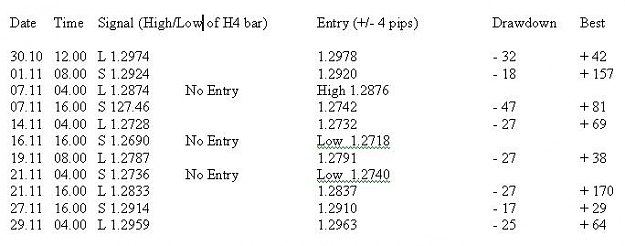
Weekly update to url for Imperatorfr, TaHui, Oxido, Jamz... Only 1 trade this week for +164 so far. Good to see that the drawdown was still within the expected range and we are now starting to see a nice 'best' grouping for those 'let it run' ...
Genesis Matrix Trading
- olivierforex replied Dec 4, 2012
Hi & welcome Oxido, I'm glad you found the post useful and that you got some good pips out of it. Trading is about managed risk and I don't think that you took too many risks by posting a Genesis chart without any extra indicators
Genesis Matrix Trading 2 things: .all ...
- olivierforex replied Dec 3, 2012
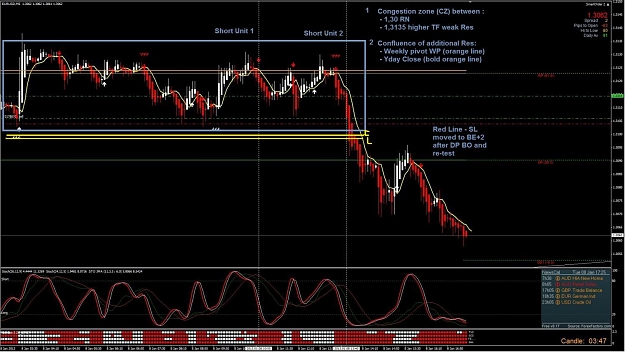
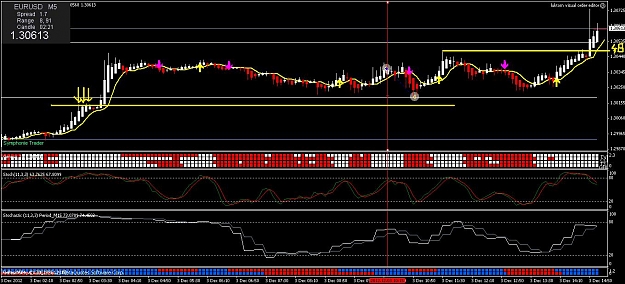
Shame as you would have got R2 and 4 pips from R3. As it's often the case, the last line of Resistance before the move up (3 arrows) will be Support once broken (SL should have been around there or at least below R1). Similarly on the last move up, ...
Genesis Matrix Trading
- olivierforex replied Dec 2, 2012
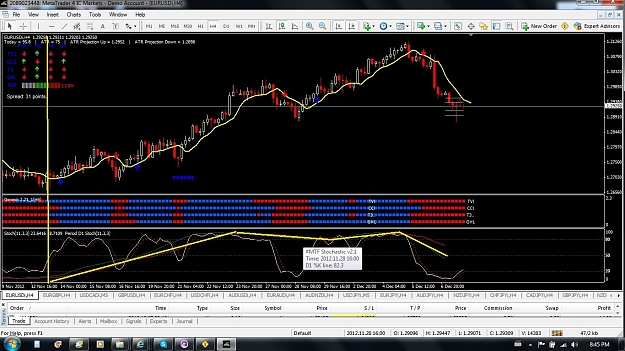
This is an outline on how you can setup a strategy on any FX pairs/instruments using Genesis and how my train of thoughts went (yours might/will be different) in designing it. 1) EU H4 chart with basic Genesis template: I picked H4 because it’s the ...
Genesis Matrix Trading
- olivierforex replied Nov 30, 2012
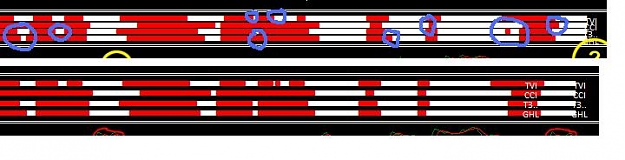
RJ, Jono: On top of the slight variations in the Stox due to possible brokers' prices (I'm surprised as the higher the TF we go, we should see fewer discrepancies), you 2 also have a huge amount of differences within the Matrix itself on all 4 ...
Genesis Matrix Trading
- olivierforex replied Nov 28, 2012
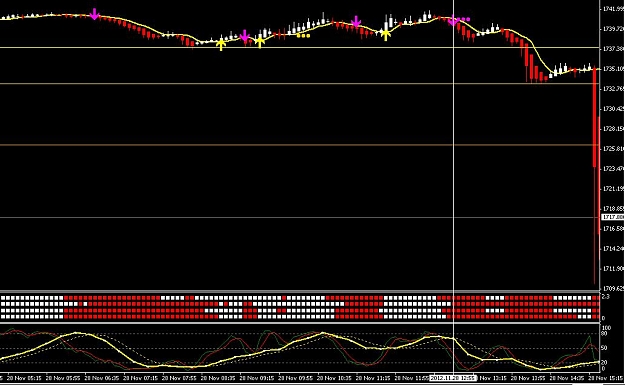
Check Gold ... $25 (250 pips with most brokers) in that 5 mins candle (if fact it happened under 1 minute); at least Genesis was the right way (good old CCI didn't turn long) & the last yellow line is S3: we needed S4/S5/... in this case lol
Genesis Matrix Trading
- olivierforex replied Nov 26, 2012
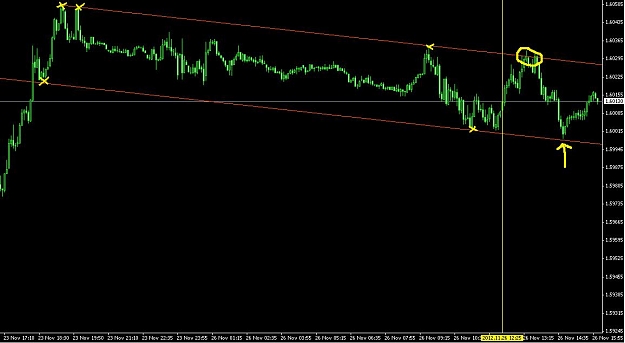
Because of Friday's move, the pivots are quite distant from each other in GU (R1 is 73 pips away from the DP). When it is like that, a little bit of extra work with (trend)lines can be useful for finding possible resistance/support/exit points. ...
Genesis Matrix Trading
- olivierforex replied Nov 24, 2012
Also, open any new chart (EU for example) and add a chosen template to it. Now click on 'Market Watch' (see picture below) and this will show you ALL the instruments available in your MT; if you can't see them all, right-click on 'Symbols' & select ...
Genesis Matrix Trading

- olivierforex replied Nov 23, 2012
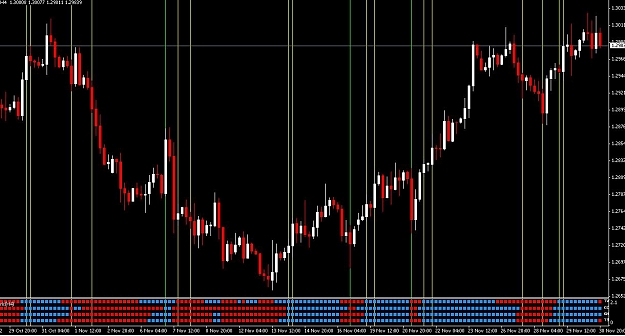
Hi Insainty, Please have a look at this first: url And this is the same view that you'd had at the time of your short entry (roughly 24 hours showing on your chart, that works for me): They look quite similar: a move up followed by a period of ...
Genesis Matrix Trading
- olivierforex replied Nov 22, 2012
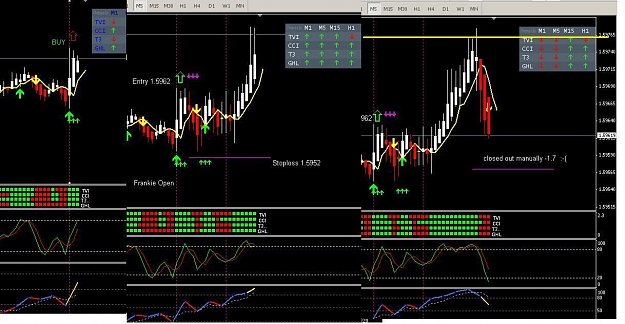
You must have your pivots on the charts: R1 at 5976 would have told you that with an entry at 5963 you might not get more than 10+ pips out of that trade (not a lot but at least your RRR with your SL at 5952 was still near 1)
Genesis Matrix Trading
- olivierforex replied Nov 20, 2012
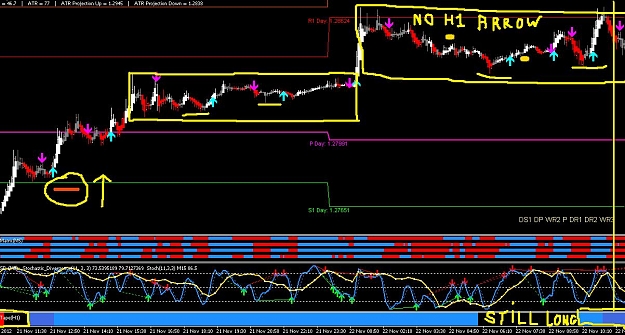
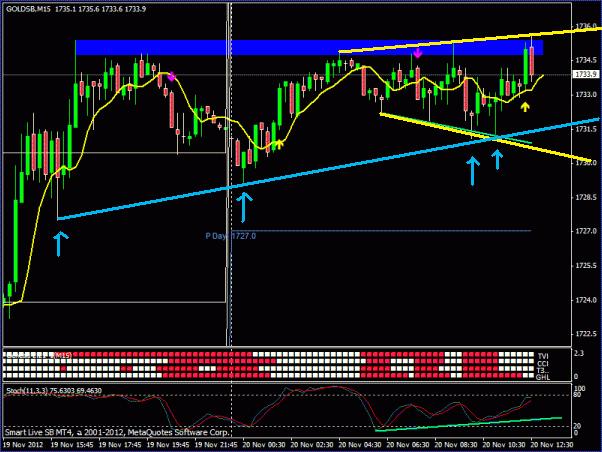
Gold is tough at the moment on pure technical analysis in the smaller TFs: For Long: blue rising trendline with 4 touches (strong) + M15 bullish divergence. For Short: flat top ("produces market drop") as the saying goes + M5 bearish divergence + ...
Genesis Matrix Trading
- olivierforex replied Nov 20, 2012
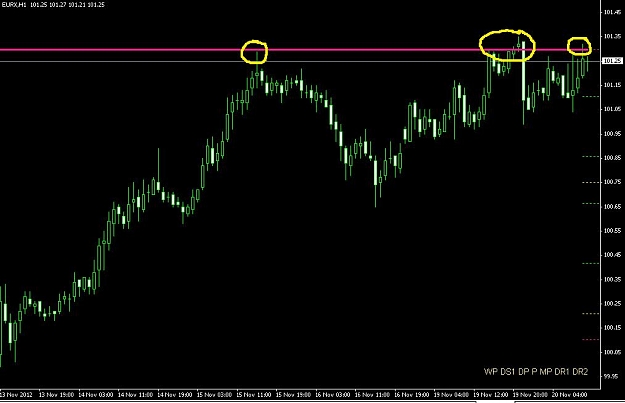
.....Having said that (I've just noticed, sorry) ... EurX Monthly Pivot MP has been resistance at the same 3 times that EU has attempted to get higher and settle above 1.28xx (last Thursday, yesterday & today). Please don't go short EU on the ...
Genesis Matrix Trading