- Search Forex Factory
- 385 Results (4 Threads , 381 Replies )
-
 Spudfyre replied Apr 26, 2013
So as they short trend comes to an end, we can see how this system gave us plenty of notice to exit. Sure, you could have stayed in and rode it out a bit longer, but not many pips more to be gained from when we first saw the warning signs. You can ...
The Forex Trend
- Spudfyre replied Apr 26, 2013
Now, we really have no option but to exit this short trend. Risk takers could try one more candle to see what happens, but here the odds are starting to move against us. My tell tale sign along with the STD DEV and Momentum is that "U" shape forming ...
The Forex Trend
- Spudfyre replied Apr 26, 2013
So as we move along the HA goes back to red, and the Stochastics goes back down across the 23.6 level. There's a blip in the STD Dev blue line, so things might start to change. That blip may also be caused by the bump in our short trend when the HA ...
The Forex Trend
- Spudfyre replied Apr 26, 2013
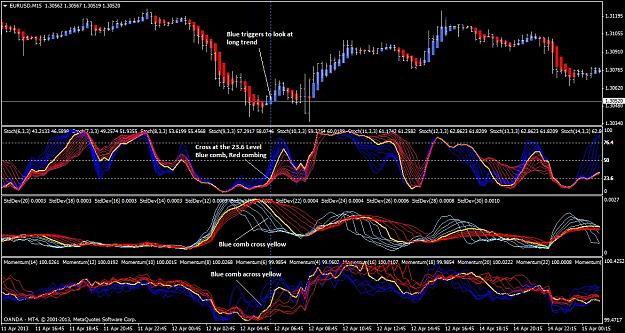
Here we go....critical moment of decision and the power of Momentum (along with the other indicators here): Heiken Ashi turned blue and our Stochastics yellow BS Line crossed up from 23.6....this would normally in the Stochastics world have you ...
The Forex Trend
- Spudfyre replied Apr 26, 2013
Jump forward a little. We now have the Stochastics crossing 23.6, this is a safe exit point...but an early exit from this trend. See what our Standard Deviation is doing...just purring along above the yellow line. I'm more worried here about the top ...
The Forex Trend
- Spudfyre replied Apr 26, 2013
The next few charts walk through a live trade, and watch carefully because you will probably not believe how something so befuddled looking as the Momentum indicator along with these other indicators can tell us so much. There's nothing special ...
The Forex Trend
- Spudfyre replied Apr 25, 2013
Below is an example of a Stochastic Indicator "fishnet". When the blue and green lines make a criss-cross pattern like this you can almost always count on a ranging market. What's happening? Well it is a lot like the market has it's wires crossed. ...
The Forex Trend
- Spudfyre replied Apr 19, 2013
You can get some great early signals for a trend change with this system. Heiken Ashi isn't pointing to a long trend coming, but everything else is. Classic stochastics blue is tight to yellow BS Line and you may npt see it in this pixture, but the ...
The Forex Trend
- Spudfyre replied Apr 19, 2013
So lets take a closer look after entry and what is happening in this weak long trend and what the indicators tell us. Between the green vertical dashed lines a lot happens in our long trend. First, our stochastic blue line comb is breaking apart. ...
The Forex Trend
- Spudfyre replied Apr 19, 2013
This is a chart of a little more complex trend, but you will see how the rules hold true and keep you out of trouble. What we'll see here is the long trend form, face a short but steep short and then back to a long trend again. We can follow this ...
The Forex Trend
- Spudfyre replied Apr 18, 2013
Last post for the day, here's a chart where we can see why the trend wouldn't develop: Heiken Ashi turns blue. Stochastics cross the 23.6 level, blue is combed, red was tight and just spreading. BUT, notice the stochastic jumble of red and blue ...
The Forex Trend
- Spudfyre replied Apr 18, 2013
So here's another chart: Our Heiken Ashi turned red. Jump down to Momentum at the bottom - see the blue lines crossing the yellow signal line, that's the death of the previous long trend. Momentum is always signalling the death of a previous trend. ...
The Forex Trend
- The Forex TrendStarted Apr 18, 2013|Trading Systems|70 replies

This is how to trade a Forex Trend. It's a system, and success is based on your discipline to ...
- Spudfyre replied Feb 17, 2013
Now of course the start of a short entry is the close of a long price cycle, and likewise, the close of a short price cycle is the start of a long price cycle....well at least in a perfect world. Let's look at the close of our short trade entry ...
Volume Price Level Trading
- Spudfyre replied Feb 17, 2013
The price cycle like so many things in Forex is easy to see after it is all done, but how do we identify them before they happen? Well, this is actually fairly simple and systematic. Let's look at a short entry. First we need some indicators: Volume ...
Volume Price Level Trading
- Spudfyre replied Feb 17, 2013
VPLT Transition Trading Now that you see how price and volume work together, we can get a little more complicated and feast a little more on pips. Transition Trading with VPLT is identifying the start and end of long cyles. You have probably noticed ...
Volume Price Level Trading
- Spudfyre replied Feb 6, 2013
The chart below is a "short" MACD example, where the MACD histogram is below the MACD "0" level. The chart below shows 3 vertical red lines numbered 1, 2 and 3. These lines are established like normal VPLT, where volume has peaked -- except we are ...
Volume Price Level Trading
- Spudfyre replied Feb 5, 2013
VPLT establishes what is known as the "major price level" when 2 things are known: 1. That we have a traditional VPLT volume spike 2. MACD histogram bar cross the "0" MACD level. Our volume peak can happen before the MACD crossover, but the MACD ...
Volume Price Level Trading
- Spudfyre replied Feb 5, 2013
If you are having trouble "seeing" the market with VPLT alone, you can use other indicators to help you. In doing so, you need to remind yourself that these added tools help support your VPLT decision. Now, there are all sorts of tools to use like ...
Volume Price Level Trading
- Spudfyre replied Jan 26, 2013
Volume up, price up....price headed to a new price level. And so we go on, in this same manner. A few tricky spots to think over in all that, but for the most part the market was extremely predictable. It may seem that we are chasing 2-3 pip trades, ...
Volume Price Level Trading