- Search Forex Factory
- 16 Results
-
 whatfx replied Apr 16, 2013
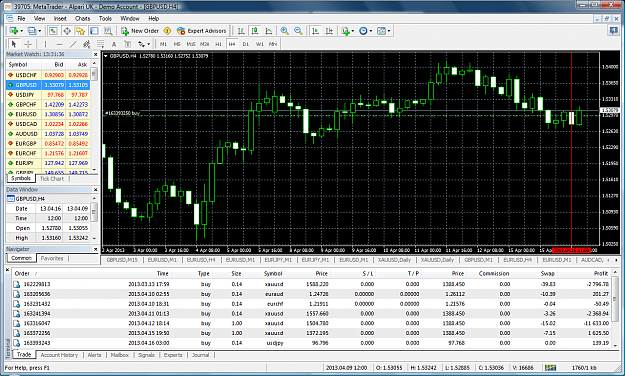
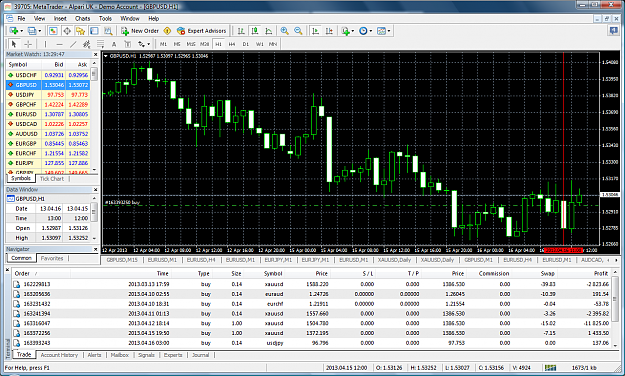
here are the charts for GBPUSD. i have highlighted the h4 and h1 bars with the red vertical line. as you can see both red engulfing bars. but a sell trade did not work out. what went wrong ?
H4 Power
- whatfx replied Mar 27, 2013
also, what if the MACD bars are above zero and going up, but both the ma's on the macd are below zero near the bottom (as shown in this chart example where the red vertical line is) image
Third Screen Strategy - Dr. Alexander Elder
- whatfx replied Apr 18, 2012
pangu question for you. it is still unclear as to when and where to count the 81 pips from. say 81 pips move occured, as in the chart example below. from top blue line to bottom blue line - 81 pips move from 13170 to 13089. however after the 81 pips ...
The MotherFibber
- whatfx replied Apr 13, 2012
image m30 chart showing long entry where two blue lines cross.
The MotherFibber
- whatfx replied Apr 13, 2012
see attached 4 hr chart. downmove from first blue line to second blue line over 81 pips. you then scroll down to m30 and enter a buy, as long as there has been a retrace from the extreme low. i entered at 13136. stopped out - 30 pips.
The MotherFibber
- whatfx replied Apr 2, 2012
see attached chart pic. as marked by the red lines, these moves were 81 pips, but from the candle lows to candle highs. so the candle low / high range be considered a valid move for 81 pips...?
The MotherFibber
- whatfx replied Mar 6, 2012
i entered at 86.87. long. as marked by the cross of the two blue lines on this chart. this was an ideal trade to take. the previous candle was bullish and closed above the sell candle. therefore signal to go long. price was also above 50 sma, near ...
Buy sell line trading


- whatfx replied Aug 4, 2011
also, how would you deal with the trades contained within the two marked red lines in the attached chart. it appears the first red bearish candle triggering a short would be a success. and the following trades after that are prone to be stopped ...
Price action momentum trading
- whatfx replied Jul 22, 2011
[/quote] ok. thanks . i got the SL bit now. it seems though, that one has to be glued to the computer all day to check for bounces. and indeed to check for stop losses if trade is triggered. due to work committments, thats a difficult thing to do ...
Bread and Butter Trades
- whatfx replied Jun 22, 2011
f0ckin 80's women were gorgeous !!! remember lesley ann-down ? she truly was the 'it' girl at the time...really amazing..... image
EURUSD

- whatfx replied Apr 15, 2011
see attached points marked with yellow lines....
Trading VSA the way NSK does
- whatfx replied Apr 15, 2011
in that you cant filter out the false moves. have a look at the attached chart. gu. volume at the start decreases, price increases. you would then enter a short at a chosen point. however, the price keeps on increasing does not fall, so short ...
Trading VSA the way NSK does

- whatfx replied Mar 7, 2011
ok, so this morning at london open. first sell trade on eu, a loss. of about 30 pips. 9.05 am alpari time, and 8.05am london gmt time. although the next buy trade would have been a winner. so thus far about break even. chart shots:
Profit All Day System
- whatfx replied Sep 28, 2010
here image here it is. i entered just after 10.00am 28 sept 2010. when price moved above 50 ema upper level. also, price moved above the 5 sma (thick yellow line). also supertrend 15 min showed buy. so i entered a buy. came out at + 30. no more ...
Multiple Trading systems gbpusd only
- Posts by Member Search: 'whatfx'