- Search Forex Factory
- 171 Results (3 Threads , 168 Replies )
-
 the redlion replied Jun 5, 2016
Momentum as in classical mechanics is the P=M*V of course in forex there is no mass and there is no velocity although some traders would swear by the fact that orders create other orders in the same direction, now this would be seen in auto ...
Technical Analysis Fallacy
- the redlion replied Dec 1, 2015
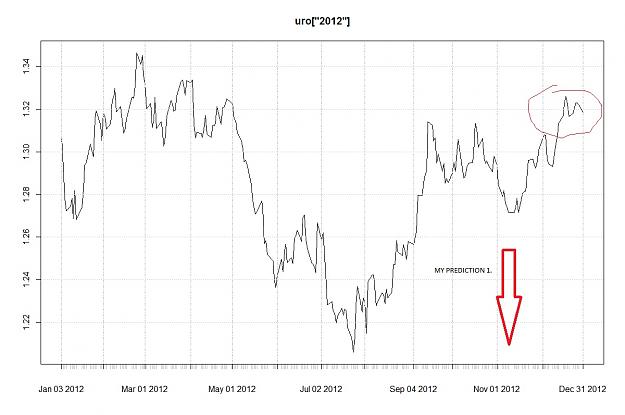
image most people at least on twitter think this thing is going up, doesn't mean they right but as far as i see Wednesday, Thursday, Friday there is data that will have high impact on the markets ...perhaps a pull back and profit taking before it ...
EURUSD

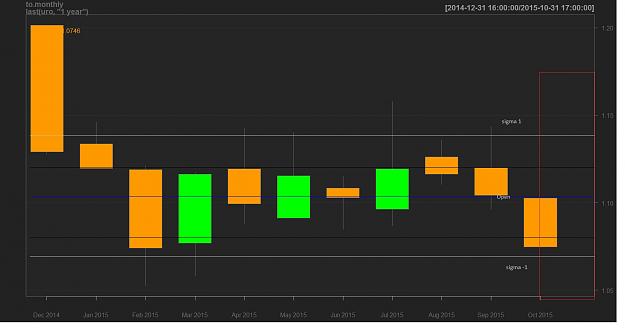
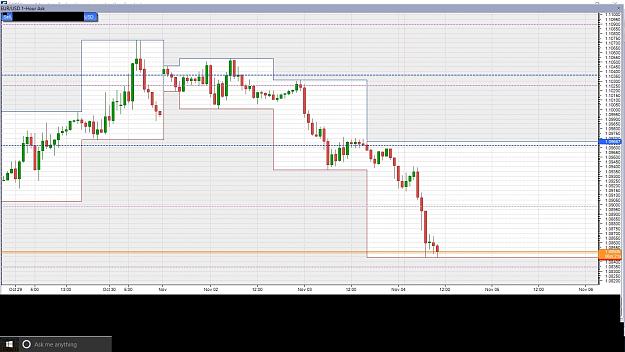
- the redlion replied Nov 10, 2015
here is the same chart all candles represent monthly time frame image
Technical Analysis alone will not give you an edge
- the redlion replied Nov 10, 2015
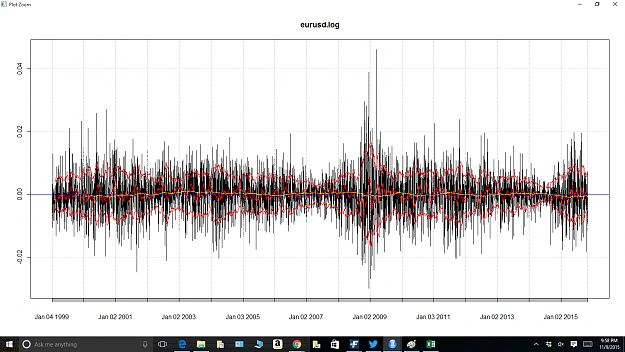
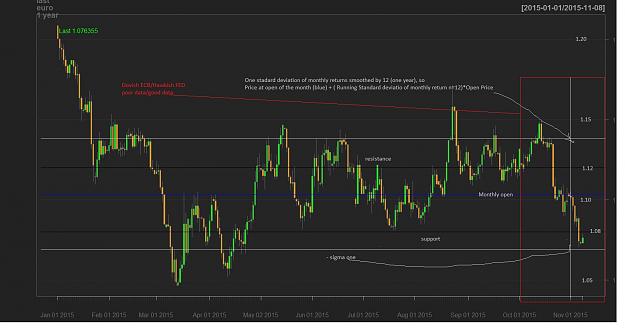
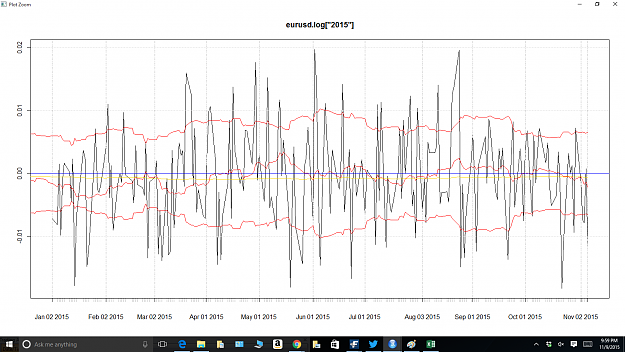
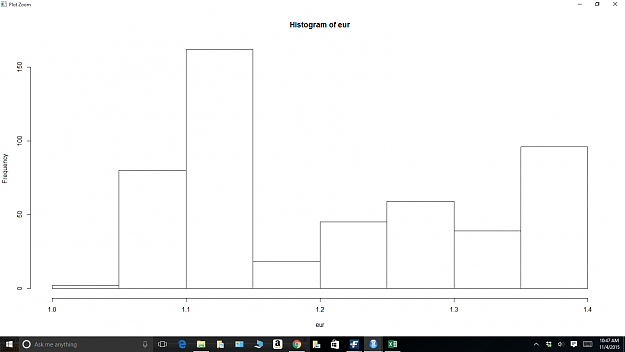
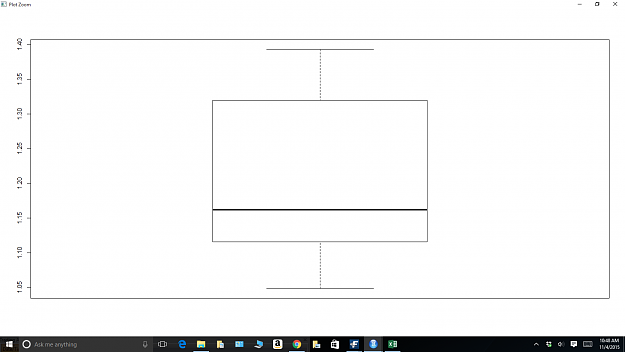
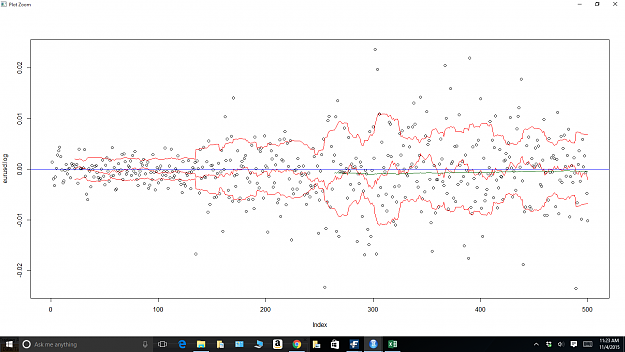
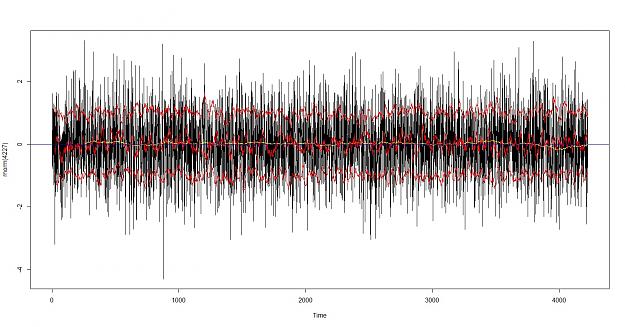
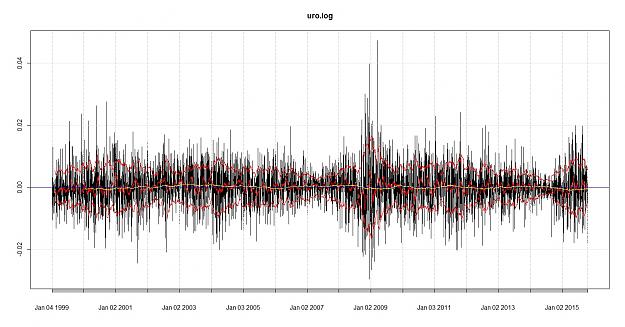
Interesting Chart GEfx, My charts are not as elaborate, I basically look at fundamentals for sentiment to confirm market drift... image if we zoom in image red bands are volatility at sigma one, where the daily volatility smoothed over the last ...
Technical Analysis alone will not give you an edge
- the redlion replied Nov 8, 2015
Hey there friend, I think by now I have been clear on my position that T/A alone does not give you and edge as far as using historical data to accurately predict future movement. T/A being any kind of visual representation of BID/ASK price and any ...
Technical Analysis alone will not give you an edge
- the redlion replied Nov 4, 2015
There has been some very convincing papers regarding the inefficiencies of markets in times of financial crisis, and bubbles. How much can that carry in day to day or intraday events I wonder... Lately to my view the market has been seemingly ...
Technical Analysis alone will not give you an edge
- the redlion replied Nov 1, 2015
Thanks for the Link, since you and I have similar views on this subject this is more akin what I tend to use nowadays I look at the big fundamental picture starting with the macroeconomic environment, then I look at both Central banks and their ...
Technical Analysis alone will not give you an edge
- the redlion replied Nov 1, 2015
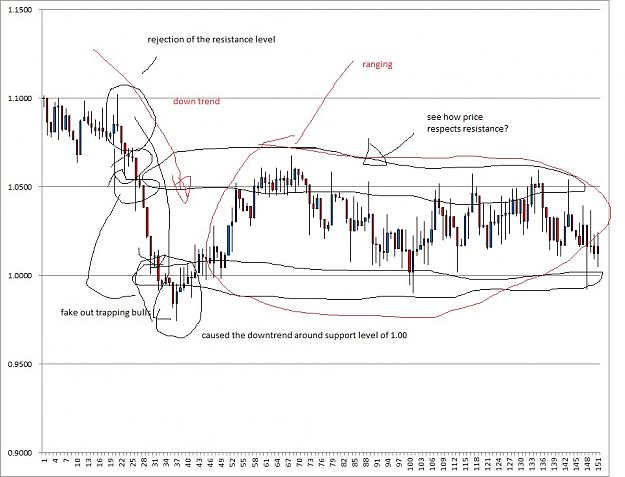
here is a simple analysis of a random chart.......you could clearly see support and resistance levels as well as price rejections around those levels. It is completely random, that means that the next candle has nothing to do with the previous ones ...
Technical Analysis alone will not give you an edge
- the redlion replied Nov 1, 2015
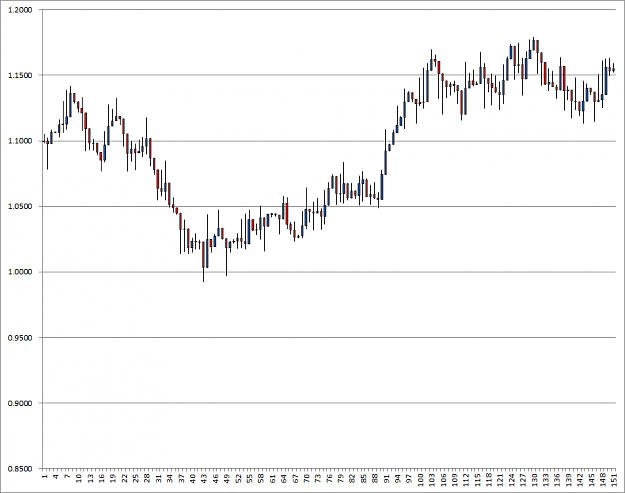
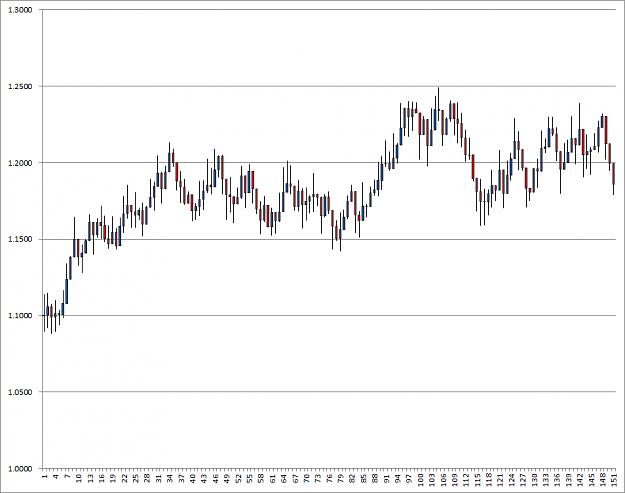
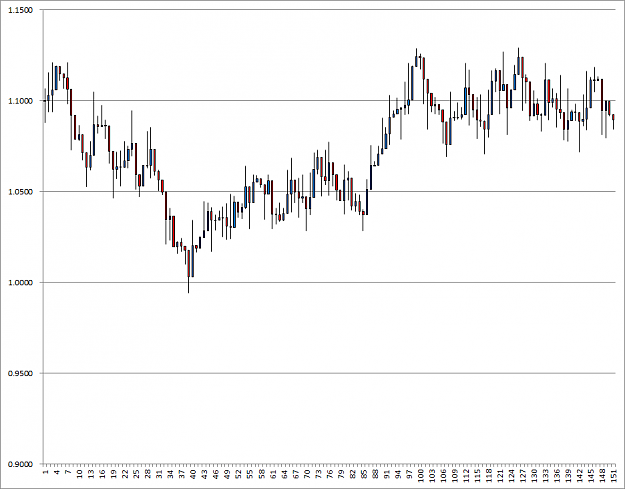
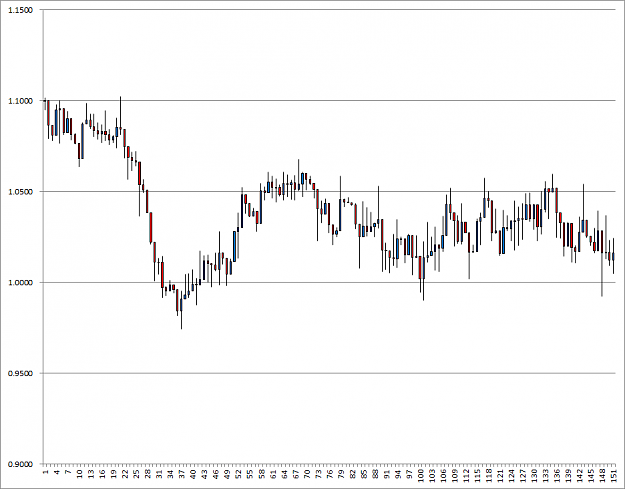
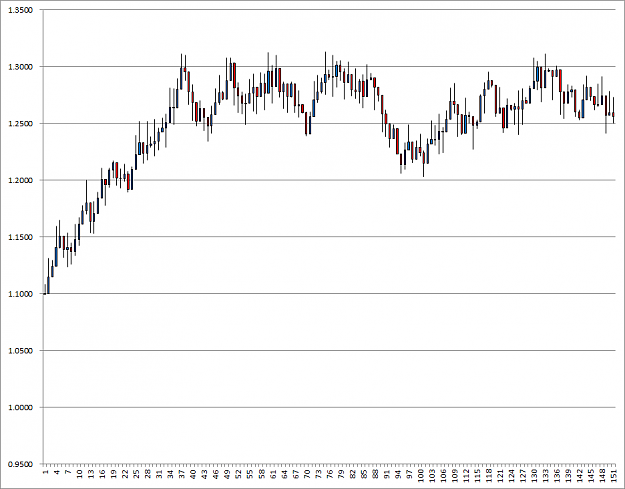
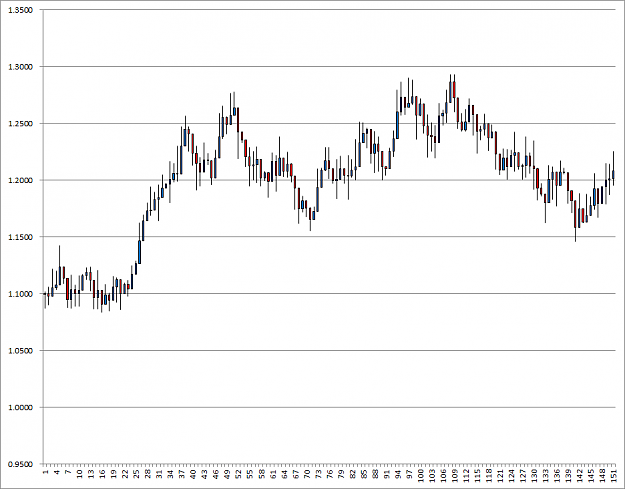
Here are some charts...do you think you can trade them? do you see the patterns? image image image image image image image image
Technical Analysis alone will not give you an edge
- the redlion replied Nov 1, 2015
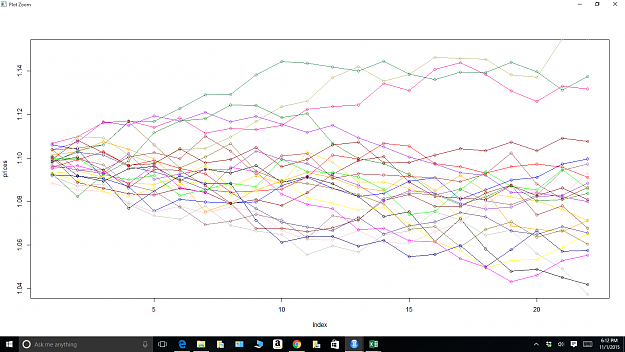
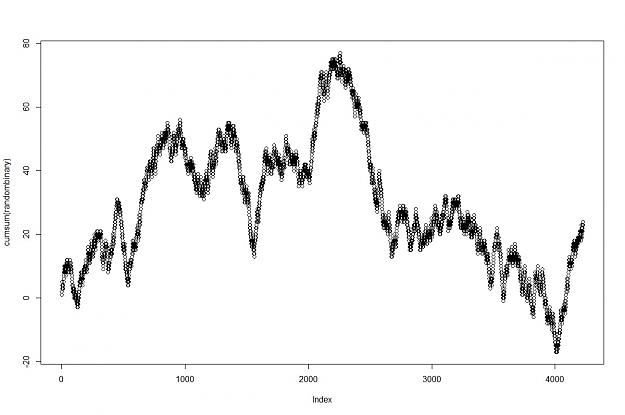
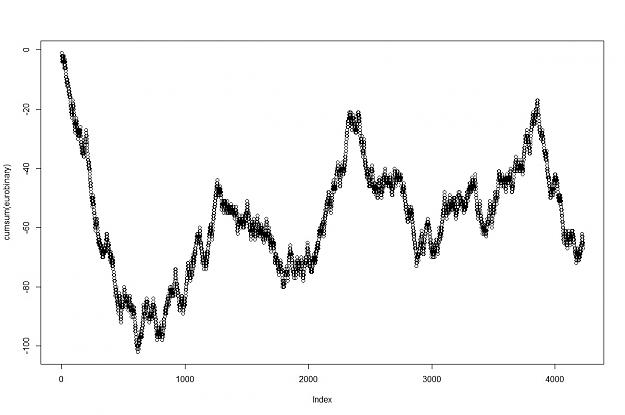
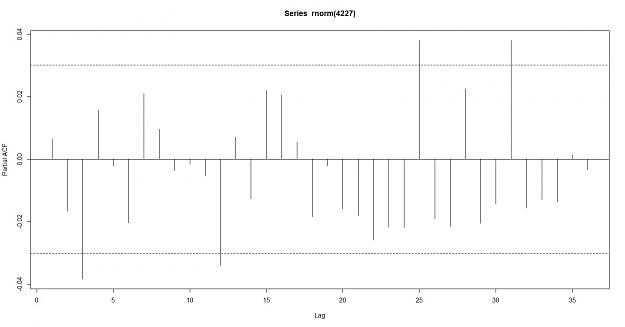
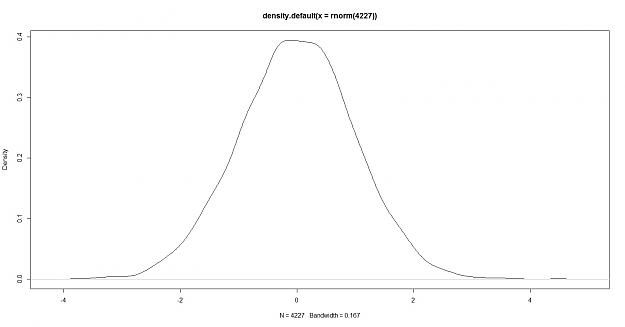
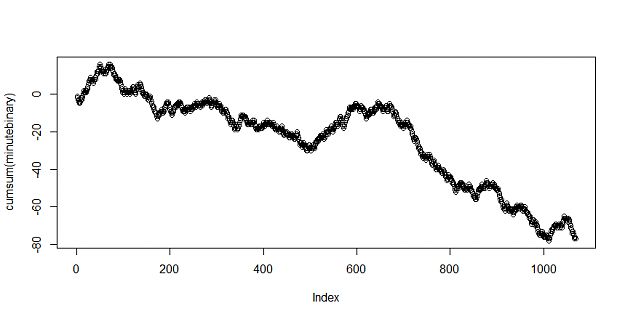
Similarly however with a random data we also see results that are not unlike the market data image if you were betting on the open price to close positive +1 100*cumulative sum of 4227 random points > 100*(cumsum(randombinary)) [1] 100 200 300 400 ...
Technical Analysis alone will not give you an edge
- the redlion replied Nov 1, 2015
you could take a coin toss approach to the markets there is the open price as your reference ----above---- is a green candle, ----below---- is a red candle [1] 0 0 0 1 0 0 1 1 0 0 1 0 1 1 0 1 0 0 0 0 1 1 0 0 1 1 1 0 0 0 1 0 0 0 0 0 1 0 0 1 0 0 1 1 0 ...
Technical Analysis alone will not give you an edge
- the redlion replied Nov 1, 2015
if I am using corrupt or false data then ... my analysis would be invalid... do you know something I dont know? Is FRED data corrupt? I am actually interested in your market predictions... please show me a pattern that you believe it is successful ...
Technical Analysis alone will not give you an edge
- the redlion replied Oct 31, 2015
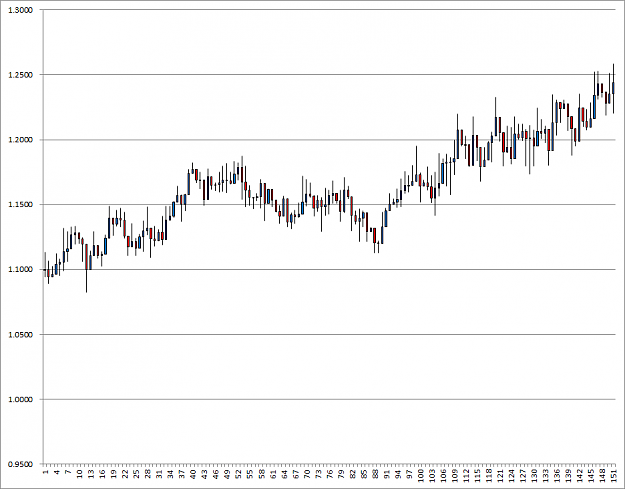
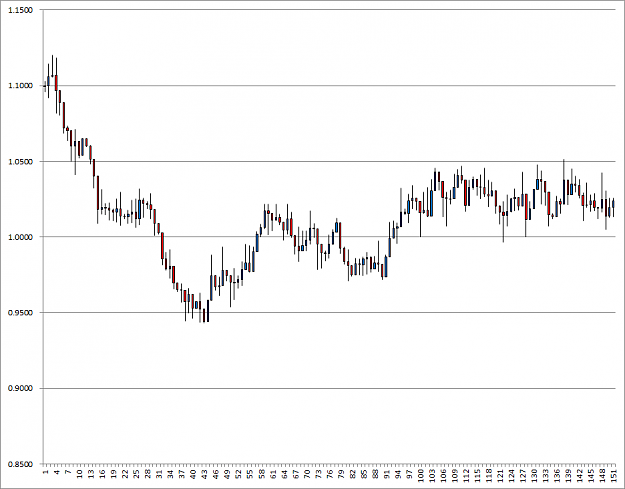
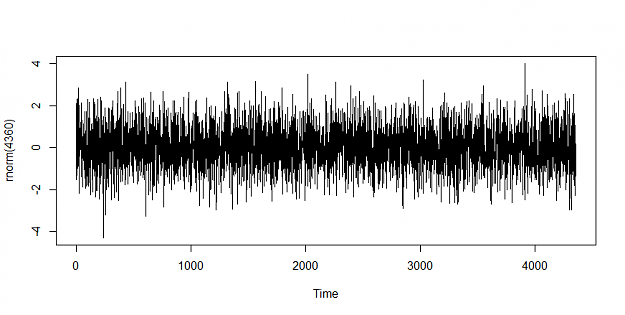
Can you tell the difference between Monte Carlo simulated data and the real market data? image
Technical Analysis alone will not give you an edge
- Technical Analysis alone will not give you an edgeStarted Oct 31, 2015|Trading Discussion|370 replies

Good evening my fellow traders, I have been a student of the market since 2011 when I joined FF. ...
- the redlion replied Oct 24, 2015
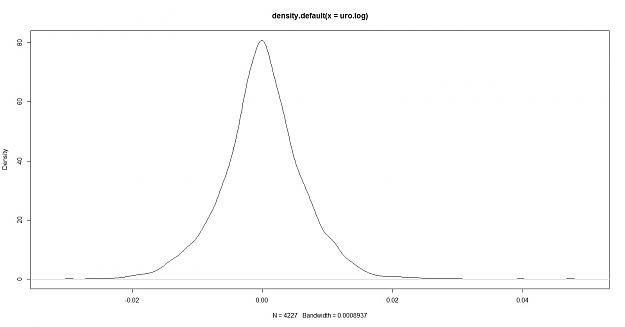
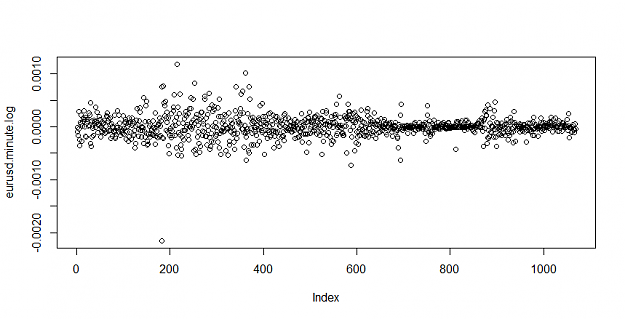
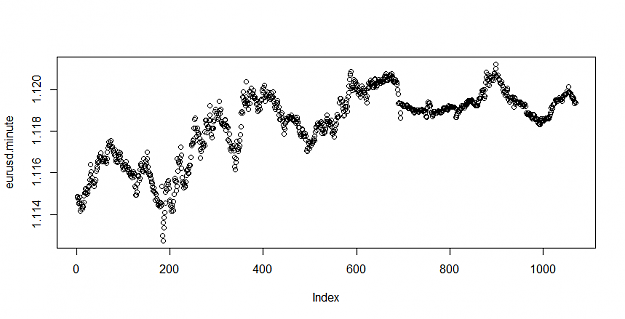
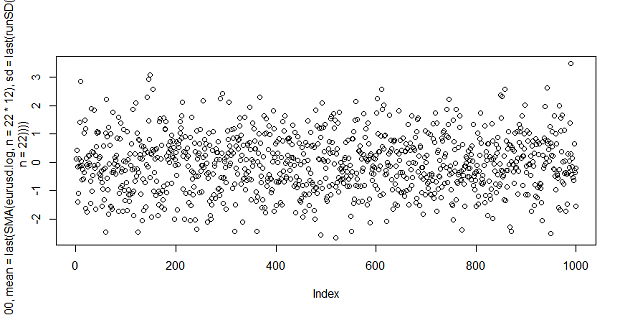
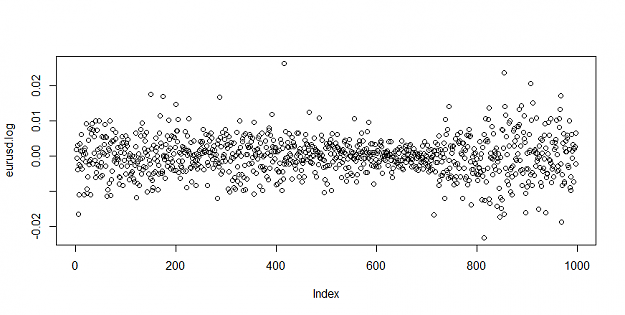
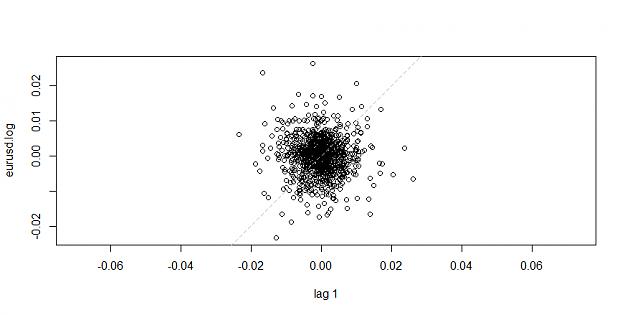
your description on how candles are made is spot on but then you go into woo woo territory, what appears more likely to me is the following: once you convert eurusd logarithmic returns of the one minute chart (pick your time frame here which works ...
Why it is possible to predict price movement?
- the redlion replied Oct 7, 2015
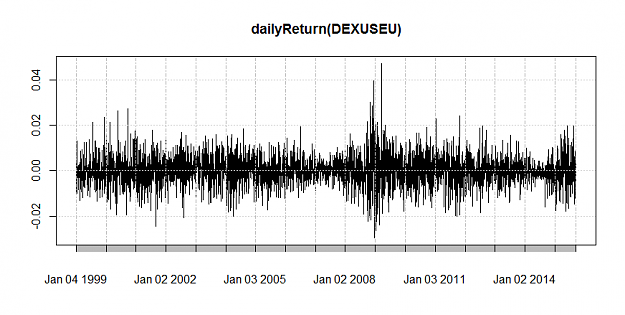
Good Afternoon Katroo, I have a question for you. I have ran statistical studies on the Euro, read many a papers on quantitative and technical analysis. I have been trading on and off for a couple of years with relative success, however It seems to ...
Just a bit of advice, for anyone, for free

- the redlion replied Sep 27, 2015
if you can see the difference real time between image and image then you will be rich soon.
How many strategies does one need?
- the redlion replied Sep 27, 2015
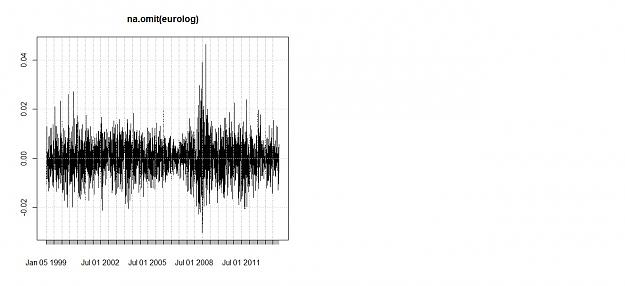
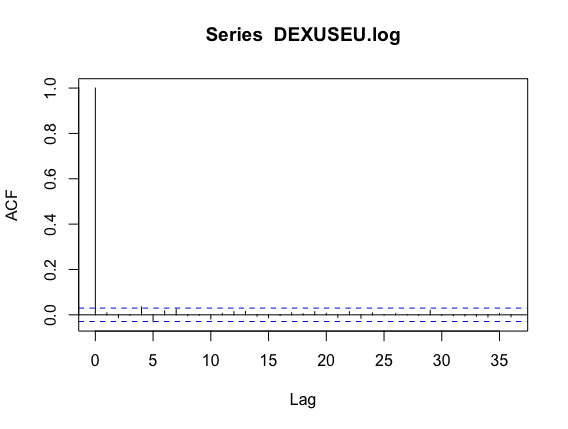
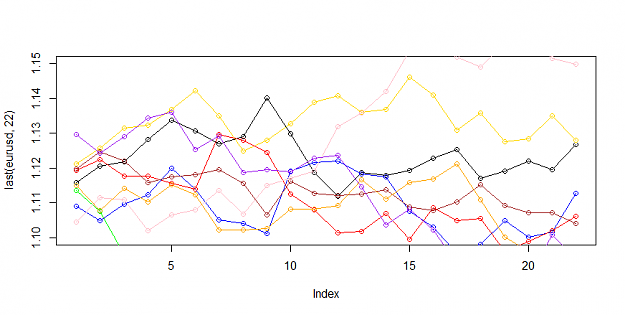
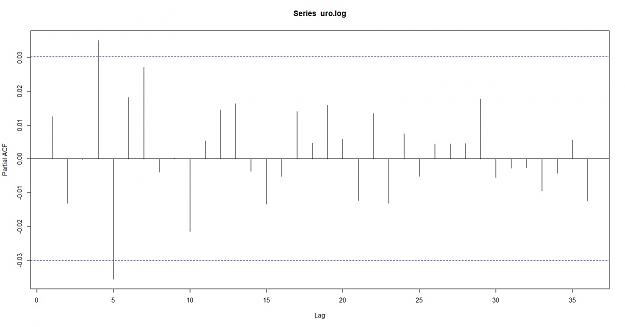
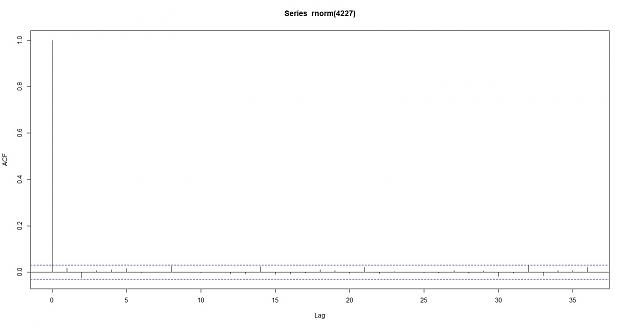
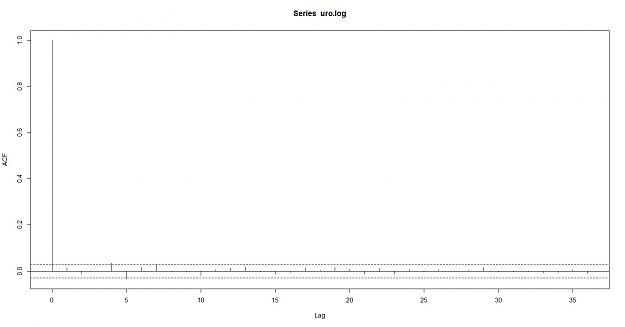
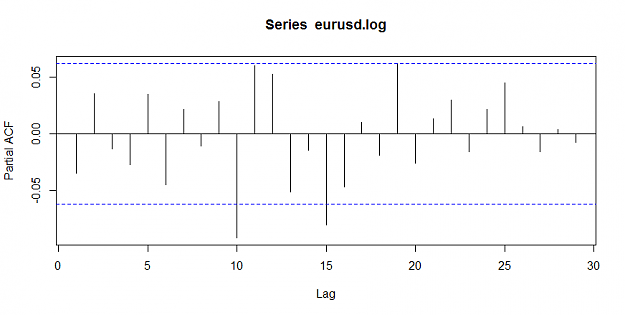
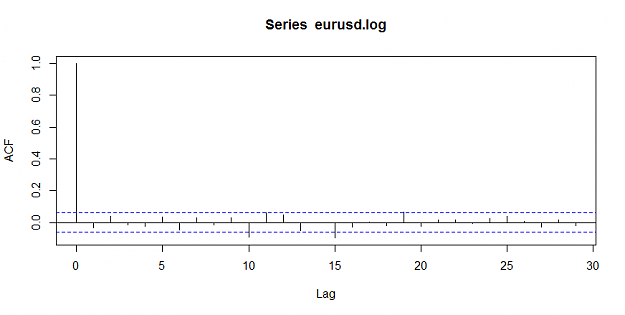
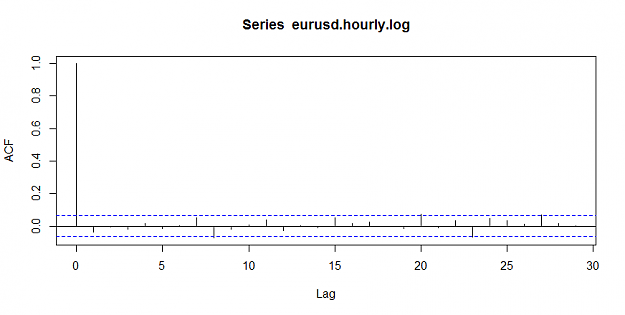
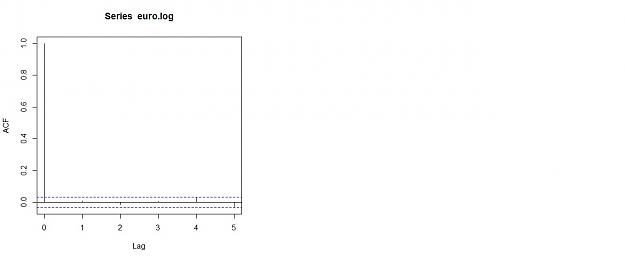
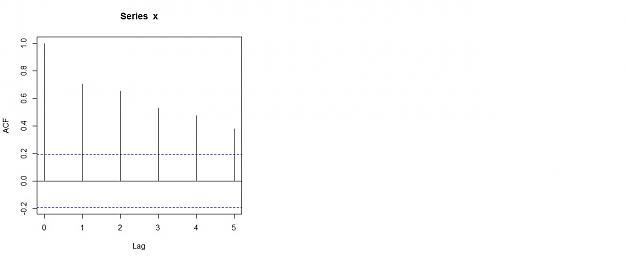
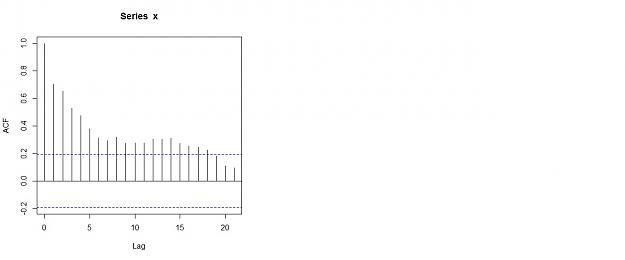
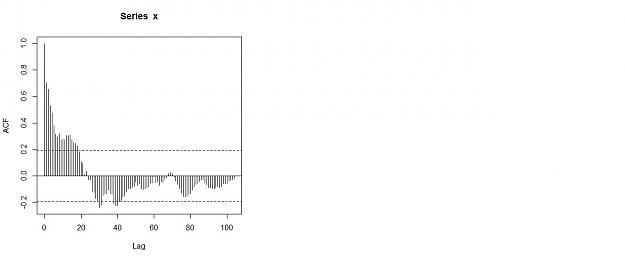
I think the problem has a lot to do with the academic discussion of EMH, and market predictability. If you take the ACF of the eur/usd log returns then we see the following image the auto correlation of the log returns at one hour can be ...
Breakout, Fakeout or a Reversal?
- the redlion replied Dec 11, 2013
see the reason for this thread is because, we can come up with answers that make intuitive sense, or what we think/postulate the market is ......yet when objective studies are implemented such as studies that in other areas are used for random ...
why have you accepted the price-predictability assumption?


- the redlion replied Dec 9, 2013
this makes intuitive sense and would account for bubbles, as it has been pointed out. However have you ever made studies on autocorrelation (serial correlation) of returns of the instrument you are trading that indeed shows what you postulate? there ...
why have you accepted the price-predictability assumption?