- Search Forex Factory
- 92 Results
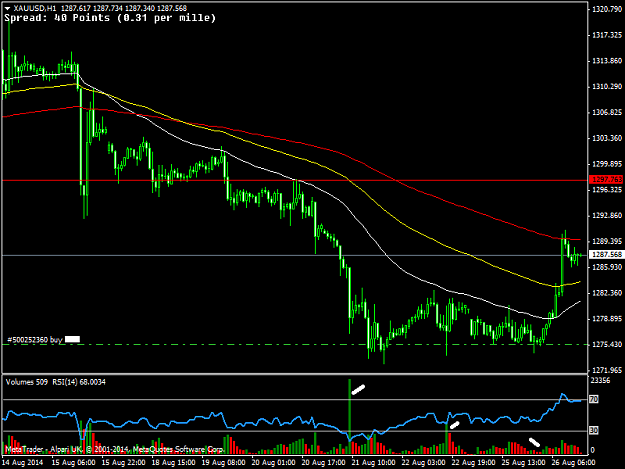
- Obaidah replied Aug 26, 2014
this is how i see it, following the selling climax marked in the chart below and a retest with low volume i decided to enter long to ride the recovery and will watch the volume closely to exit, i expect this recovery to be sort of limited and with ...
Only Gold!
- Obaidah replied Aug 20, 2014
Gold played out as expected, closed most of the shorts and kept only small portions with stops at positive, hope nobody is locked in up there.
Only Gold!

- Obaidah replied Oct 31, 2011
turns out that it was a good position, close 2/3 of that position and set the rest to +ve, you should keep an eye on these fibo levels, i'll wait for a pull back and see if a sell chance represents itself.
EURUSD
- Obaidah replied Oct 27, 2011
Buying climax — I believe that the marked bar on the following chart with that spike in volume and price closing near the lows accurately marks the top of today, Im expecting the price to drop or to go side ways AT BEST for now higher price ...
EURUSD
- Obaidah replied Sep 26, 2011
In vsa, the marked bar almost always marks the end of a rising market with very high volume closing off its highs, I believe we're diving Hope I can get some sleep anytime soon!!
EURUSD
- Obaidah replied Sep 26, 2011
I don't like how this thing is behaving! closed half of the position and set S/L for the remaining to +5, time for nap, hope I don't miss any major move Good luck everyone
EURUSD
- Obaidah replied Sep 25, 2011
I believe Tokyo session is bearish with no demand bars all over the place, its a good short entry on these charts
EURUSD
- Obaidah replied Sep 22, 2011
It's actually a question of what target up? above the shadowed area in the chart i posted a few ago there's also a consolidation range, if it happens and we break to that area then i doubt any "strong" moves to the downside, however, you can use ...
EURUSD
- Obaidah replied Sep 22, 2011
It's losing its momentum, closed most of opened short positions and set the remaining to +10-20 pips, Marketprofile suggests that the shadowed area is the perfect place to short this thing again with stops somewhere above that area, it forms a ...
EURUSD
- Obaidah replied Sep 19, 2011
confirmation please — Hello everybody, I need a confirmation if the volume of the marked bars on the chart below is the same as the volume provided by my broker I'd appreciate it if you post M5 chart from your broker Thanks in advance
EURUSD
- Obaidah replied Sep 16, 2011
selling into a rising market exhausts the buying power which causes the market to roll over and perhaps going down on taking profit, now this exhaustion could be temporary and the uptrend will resume (probably going up to somewhere between 1.4 and ...
EURUSD
- Obaidah replied Sep 10, 2011
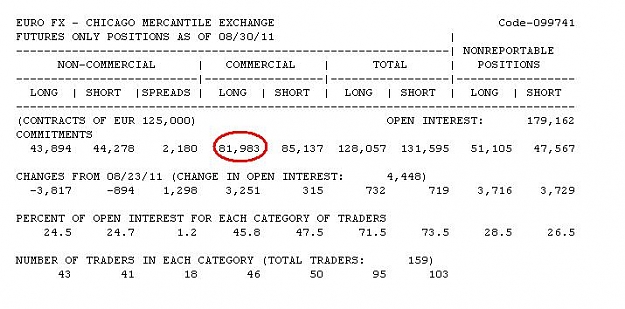
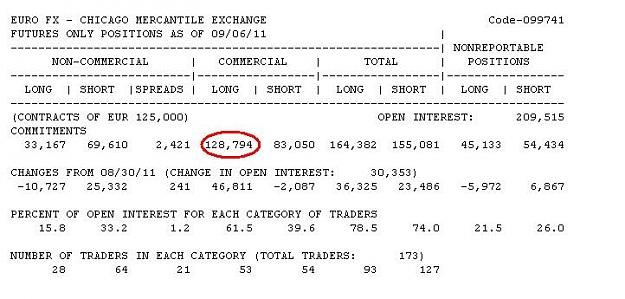
COT report is suspicious, banks have greatly increased their long positions by 58% on EURUSD in one week!! be careful guys and good luck.
EURUSD
- Obaidah replied Aug 23, 2011
Mthe marked bars shows huge selling specially in the last 2 marked bars, ultra high volume with next bar also showing high volume at the same level, which shows selling exists, on the M15 chart, the marked bar with a sudden high volume an hour ...
USD/JPY Discussion
- Obaidah replied Jul 19, 2009
somthing worth to mention on daily chart, we're retesting broken trend line, we might see 157, im not trying to pick tops and please don't unless you really know what you're doing, i prefer to stick to my plan so i'll "look" for a short once we ...
Auslanco - GBP/JPY and GBP/USD (newstrade)
- Obaidah replied Jun 18, 2009
looks like we're going for extended down move, on low timeframes however there seems to be buying going on indicated by vsa which means we're not ready to go down yet, we might go up alittle bit before we go down, i'll keep looking for shorts as ...
Auslanco - GBP/JPY and GBP/USD (newstrade)
- Obaidah replied Jun 16, 2009
selling has hit this thing twice, after the no selling pressure (number 2, see the chart below) it has rised and was hit once again by sellers, on this down move we have increasing volume (look at lower TFs for better view), im trying short here and ...
Auslanco - GBP/JPY and GBP/USD (newstrade)
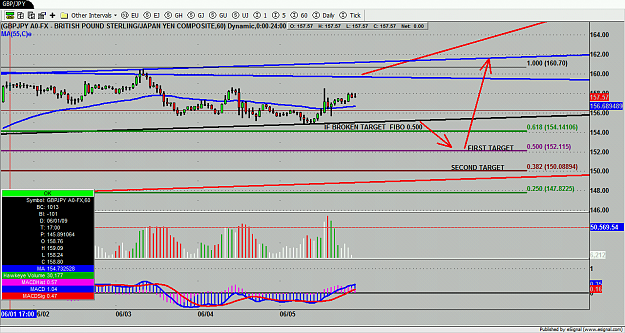
- Obaidah replied Jun 6, 2009
the question is not how fast to blow account using metatrader tick volume, the question is how much should i read nonsense on these forums untill nothing left? the following are H1 charts from esignal and MT4 broker, how interesting it is that their ...
How to Blow $200 account using VSA---
- Obaidah replied Jun 6, 2009
usdjpy broke the daily channel with both fundies and technicals (that includes vsa) confirming the break out. edit: on H1 and M30 we have successful test of no supply on low volume but yea vsa is not so liable as the market closes IMHO. one thing is ...
Auslanco - GBP/JPY and GBP/USD (newstrade)