- Search Forex Factory
- 477 Results (1 Thread , 476 Replies )
-
 Alorente replied Apr 6, 2024
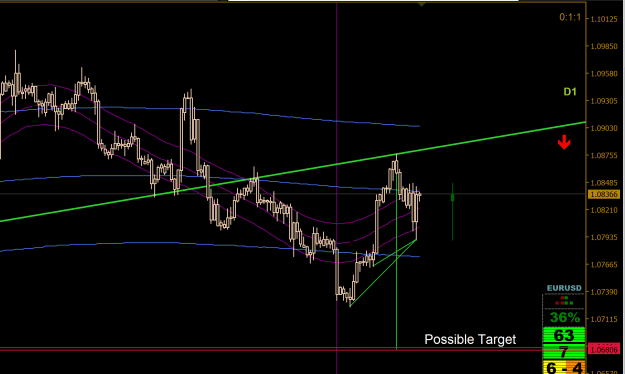
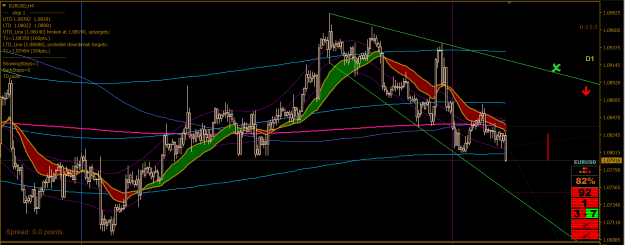
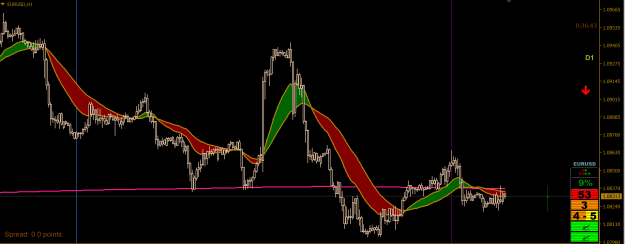
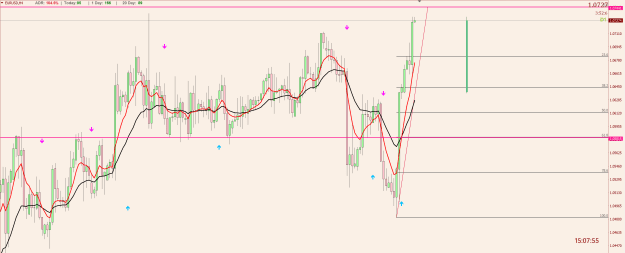
If we do get another leg down next week, possibly triggered by CPI, and using the targeting tool that Ata likes to use, the target for the third leg down could be 1.0680
EURUSD only
- Alorente replied Apr 6, 2024
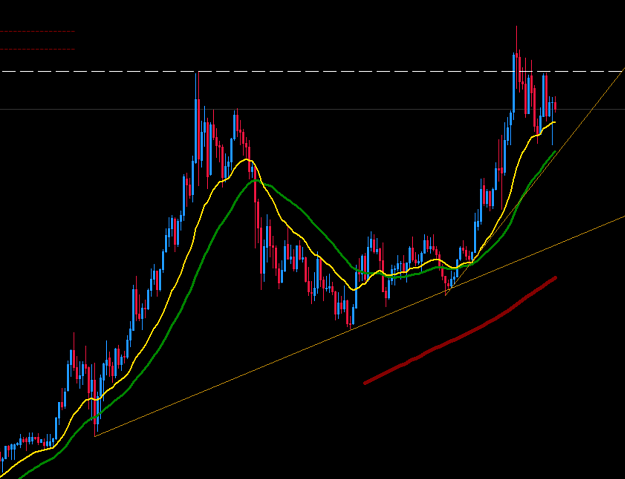
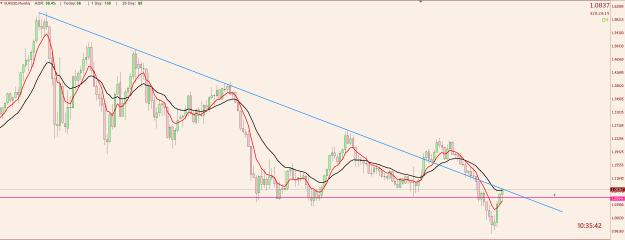
Good Saturday to all around the world. I was looking at the Monthly chart this morning to get a longer term perspective of EurUsd. On the right side you can see the Green line in the sand that appears to be breaking now. I drew parallel lines to ...
EURUSD only
- Alorente replied Apr 5, 2024
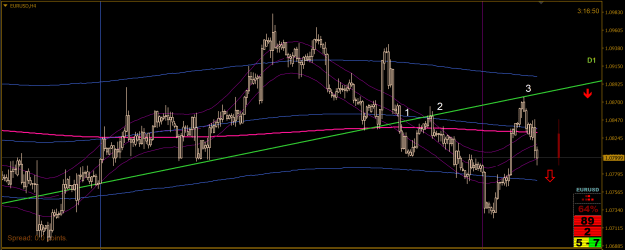
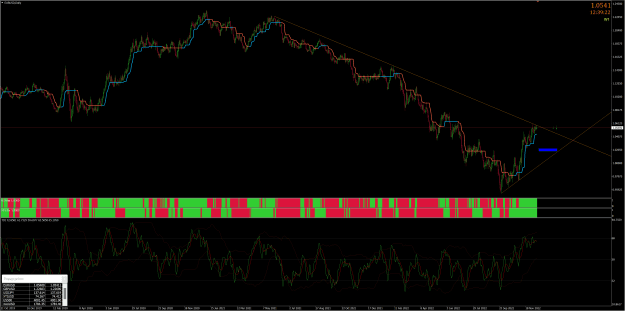
It is clean and simple price action in my view: The Green line goes back to August 2022 and it is clearly the line in the sand. It was broken at point 1. Tested from below at point 2 Retested again yesterday at point 3. Heading today for the lowly ...
EURUSD only
- Alorente replied Apr 4, 2024
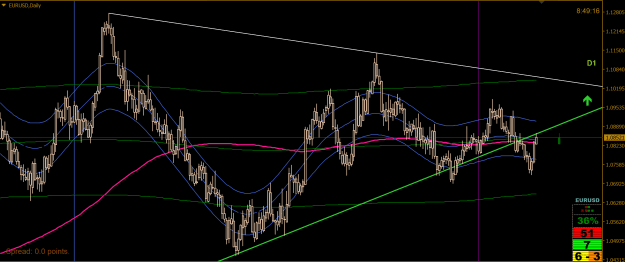
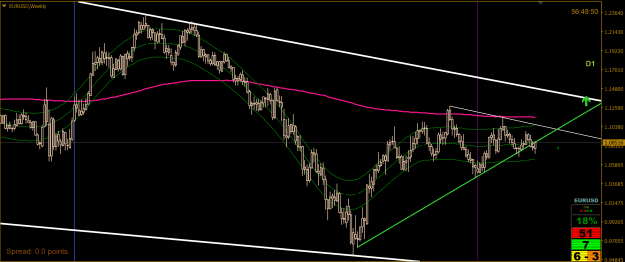
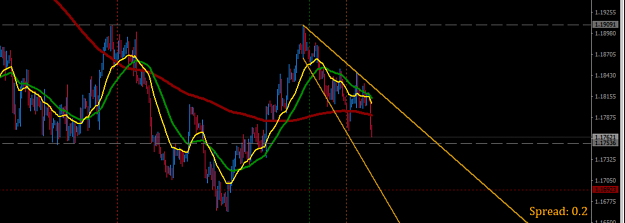
The Main trendline (Green) was tested today but so far respected. You can see in the Daily and Weekly charts how important this line is. Above it = Bull Below it = Hell
EURUSD only
- Alorente replied Apr 2, 2024
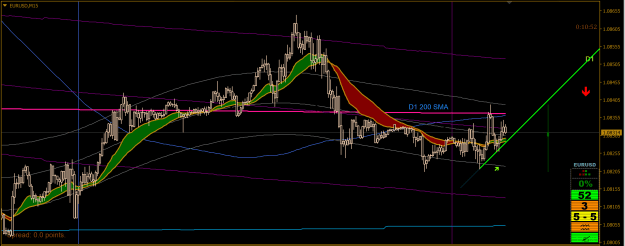
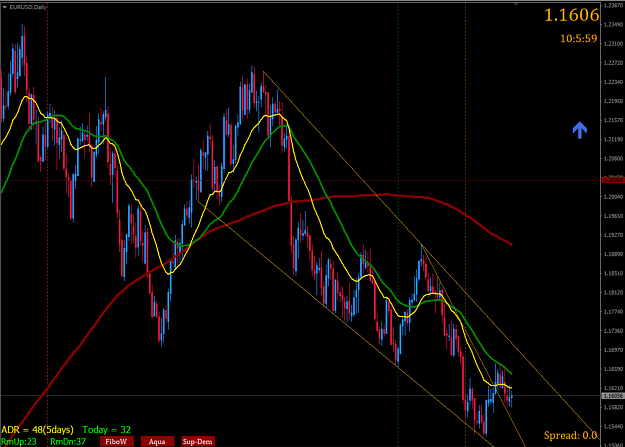
EU has respected the bottom line of the expanding formation. I think we are headed for the D1 200 SMA (Pink Line) in the next 2 or 3 days. After that, it should be down again to new low.
EURUSD only
- Alorente replied Mar 28, 2024
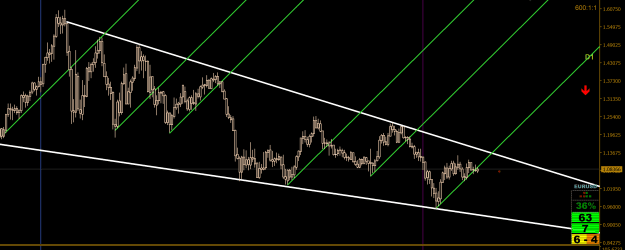
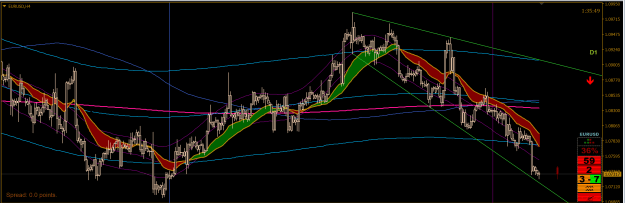
We have an expanding formation. I believe we will hit the top line around the green X, maybe next week, before dropping again to the bottom line around the 1.0600 area.
EURUSD only
- Alorente replied Mar 27, 2024
This H1 chart shows the D1 SMA (Pink Line) since March 14. Notice the 2 bounces on March 19 and 20. That is how important the Daily 200 SMA is. For many professional traders it marks the boundary between a Bull market and a Bear market for any pair ...
EURUSD only
- Alorente replied Mar 27, 2024
You can see in the attached M15 chart how EU is trying to break the Daily 200 SMA (Pink Line) since Monday but it is having trouble with it. Until that is done, there is no upside. After it breaks it should test it from the other side to establish ...
EURUSD only
- Alorente replied Mar 15, 2024
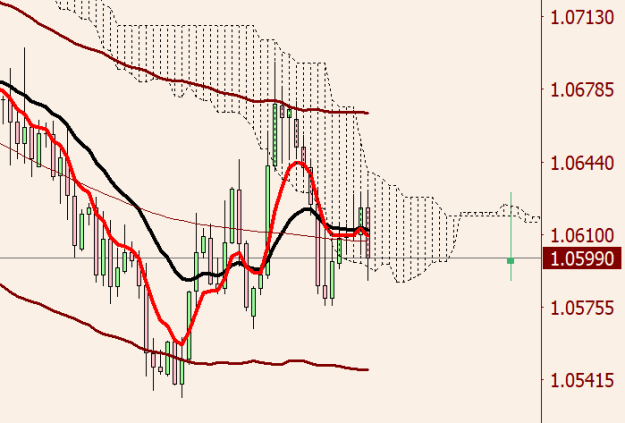
Good question... There are many ways but I will make it extremely simple for you. Here is an indicator I prepared which I always use. Put it on a H4 EURUSD chart. Set the MA inputs as follows: MA 1= Method 1, Period 20, PRICE 0 MA 2= Method 3, ...
EURUSD only
- Alorente replied Jul 13, 2023
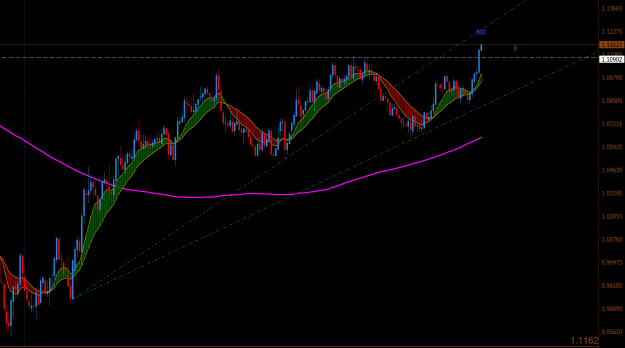
I see EU reaching the 1.1250 level (Blue Area) before any meaningful drop to test the broken level around 1.1090.
EURUSD only
- Alorente replied Mar 3, 2023
1.0460 is also the target for the forming Head and Shoulders if it breaks.
EURUSD only
- Alorente replied Jan 13, 2023
Price is at a very important line that has proven to be very difficult to break since 2007. We could be in for a reversal here to test the 38.2% Fib at 1.0358. Attached is the Monthly chart.
EURUSD only
- Alorente replied Jan 9, 2023
You may very well be right. On the attached chart you can see that the 61.8% Fib retracement from the 1.0481 bottom to the Shark top projected at 1.0744, falls exactly on a strong Support/Resistance level at 1.0581 (Pink line).
EURUSD only
- Alorente replied Dec 13, 2022
I agree with you. See attached Daily chart and the drop from 1.2270. We are now at a most crucial trendline. It is highly unlikely that it will be broken on the first try. Much more likely is a drop to the 38.2% retracement level (Blue zone) and ...
EURUSD only
- Alorente replied Dec 16, 2021
I am expecting a new high. In the monthly chart below, you can see it is forming a cup with handle formation. At some point, I expect a breakout to the upside. The reason is inflation. I believe the central banks are way behind the curve. They will ...
Gold
- Alorente replied Oct 28, 2021
EurUsd is building a solid Bull Wedge on the Daily. I know we all expect EU to drop further, but with the ECB news upcoming, I would feel uneasy about holding a short position. The chart shows a potential explosion higher. I think the safe route is ...
EURUSD only
- Alorente replied Sep 16, 2021
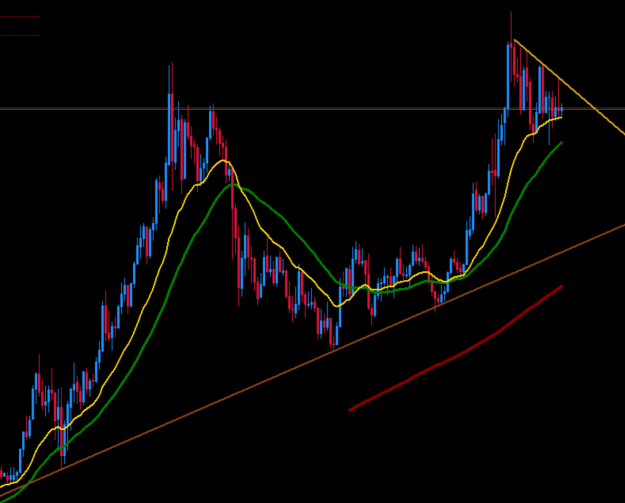
This leg down is painting an expanding formation, a continuation pattern. Another clue that the break should be higher soon.
EURUSD only
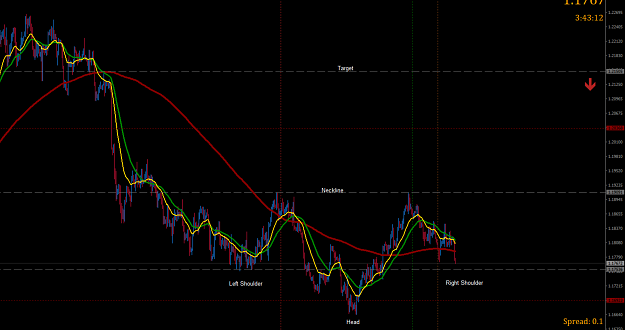
- Alorente replied Sep 16, 2021
I´ve been watching EU for a while now. I believe it is forming a perfect inverted Head & Shoulders pattern. The right shoulder will be completed at the 1.1754 level. The target once the neckline is broken , is 1.2150 See H4 chart below.
EURUSD only
- Alorente replied Sep 14, 2021
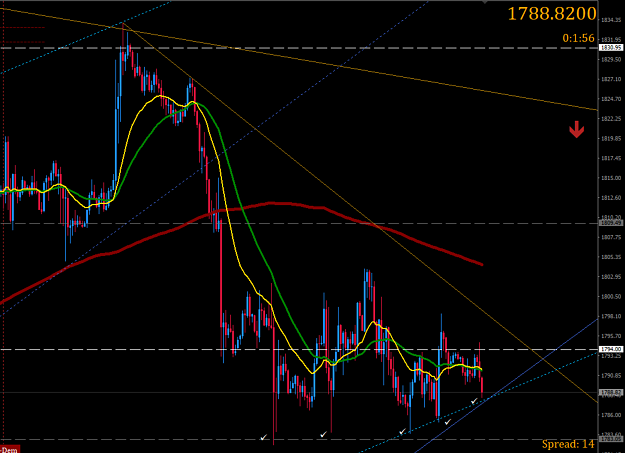
I have often wondered why is it that Gold needs so many tests of the Low/High before breaking out from a Low/High? In most other pairs, 2 or 3 tests is enough to break either way. If you can help explain this, please do. Below is the current H1 ...
Gold
- Alorente replied Sep 13, 2021
We should keep our eye on the big picture. The monthly chart shows an almost perfect Cup with Handle formation that should break higher. If and when it does, the projected price is 2786. Monthly chart below.
Gold