- Search Forex Factory
- 1,003 Results (5 Threads , 998 Replies )
- aahmad29 replied Mar 17, 2024
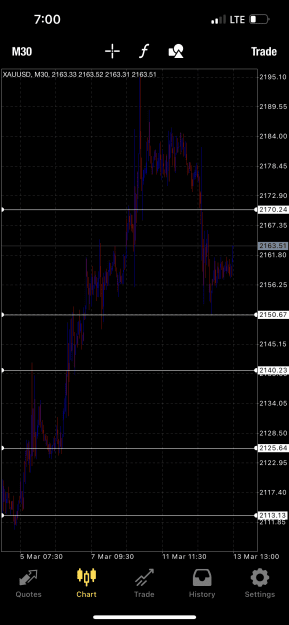
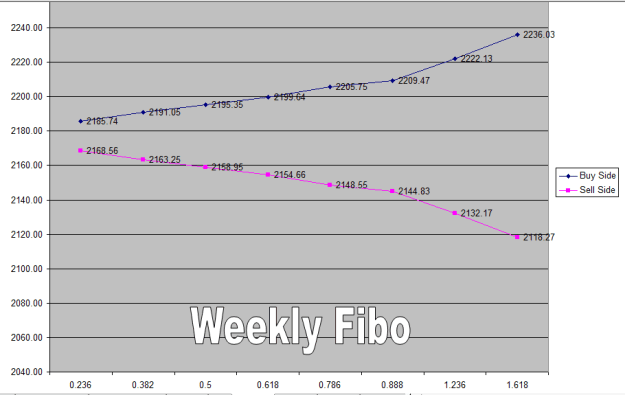
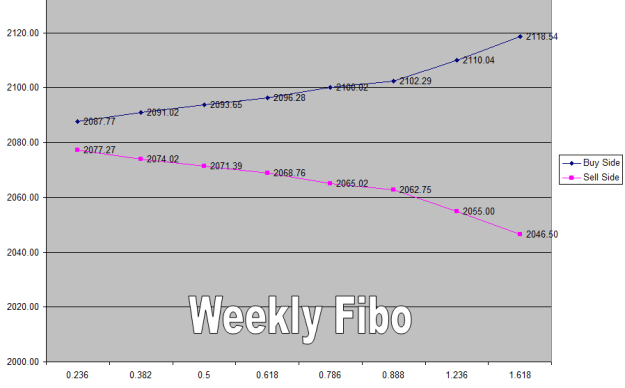
Here is weekly Fibo volatility levels. My bearish target is at 0.618(Sell Side) My expectations are break of support 2150 and price hit my 0.618 (sell side). Then I am expecting bounce from 0.618/0.786 area to 2150 and test that level which can turn ...
Gold
- aahmad29 replied Mar 9, 2024
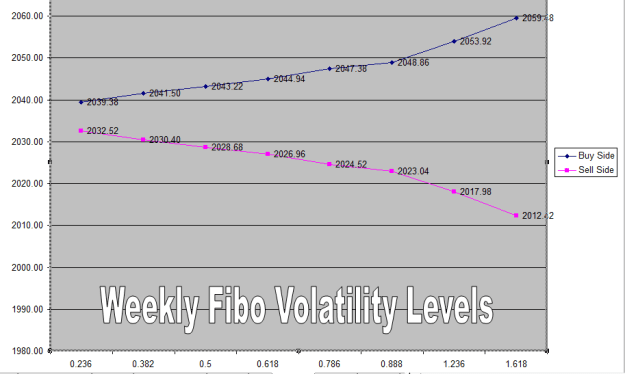
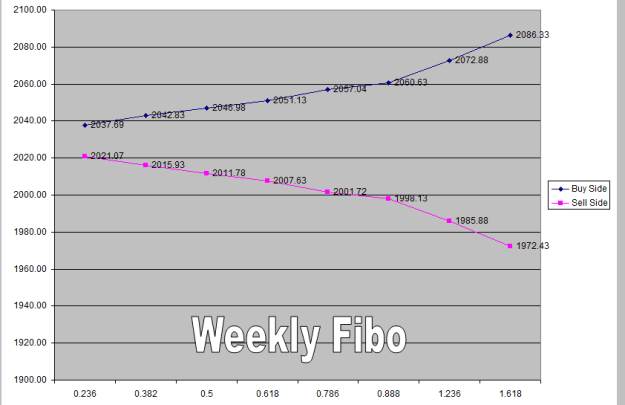
Here are weekly Fibo volatility Levels. I am only looking for establishing short positions because my weekly Fibo levels are gone above the monthly levels
Gold
- aahmad29 replied Mar 1, 2024
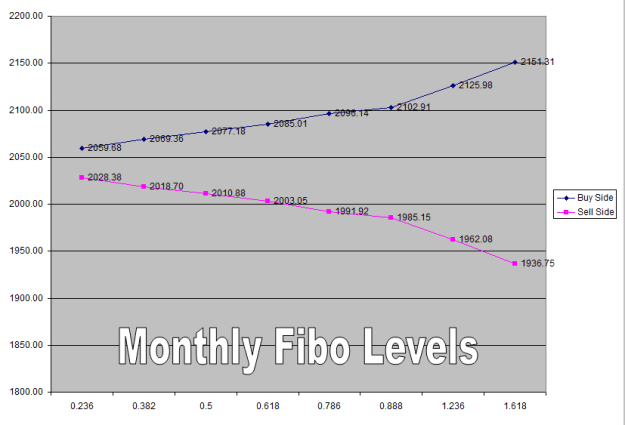
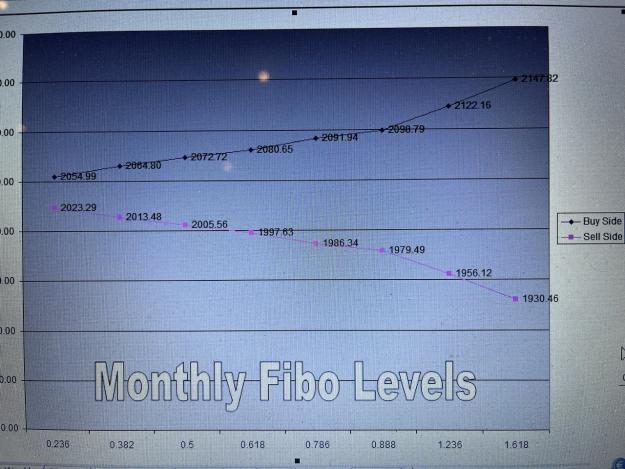
weekly cycle completed.Previously Price hit the bottom 2012 and today hit the top of cycle 2059. Now price has entered into monthly cycles.
Gold
- aahmad29 replied Mar 1, 2024
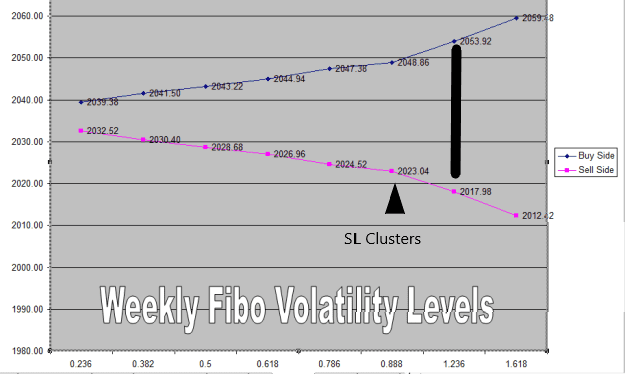
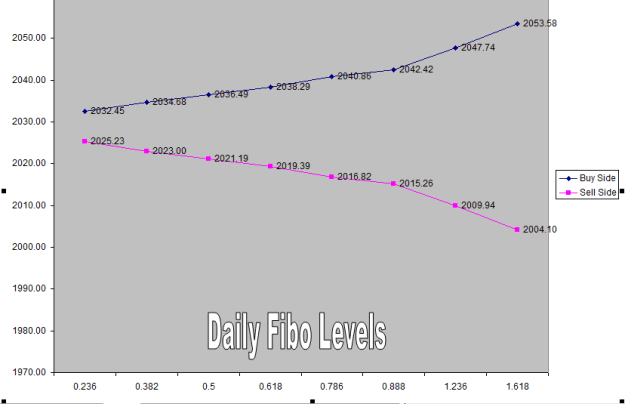
Price did not hit my last target of 2059.48 and it means that price is staying in the cycle where top is 2053.92 and bottom is 2017.98. Price has entered into big cycle and price may pushed back to bottom of cycle. SL cluster at 2023-25 is ...
Gold
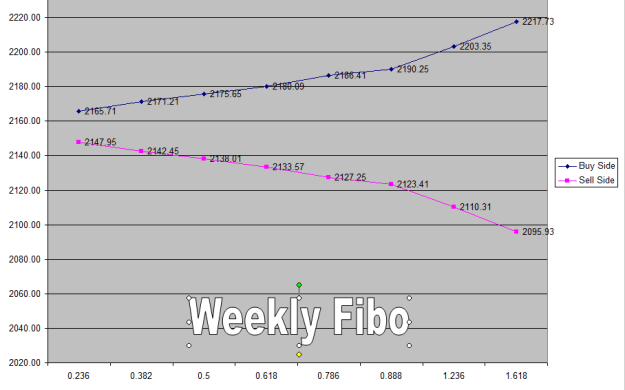
- aahmad29 replied Feb 24, 2024
I agree with you because price has entered into my weekly Fibonacci Volatility levels for Buy side. Price can fluctuate little up and down but my final target is 2053.92 and 2060 is extreme target. Here are my Weekly volatility Levels
Gold
- aahmad29 replied Feb 16, 2024
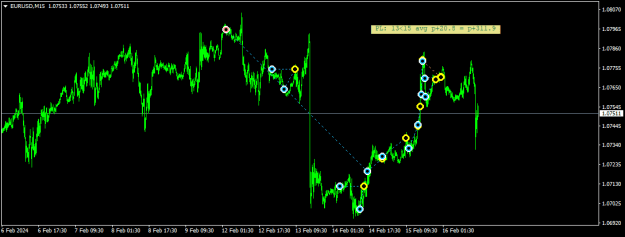
By observing your projection line, i did some scalping by adding some of my trading experience(Volume analysis). Here are results on live account so far
Planetary Cycles Trading (EUR/USD)
- aahmad29 replied Feb 2, 2024
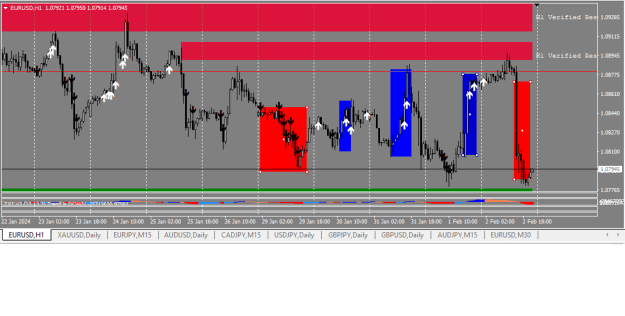
I was trying to reduce DD and it worked. My buy stop and sell stop orders based on volatility had minimal DD. Blue and red rectangles are for Buy stop and sell stop simultaneously. Here is the result of this week. Remember i used sell stop for only ...
Planetary Cycles Trading (EUR/USD)
- aahmad29 replied Feb 1, 2024
I have received many inquiries via PM about using Fibo volatility levels during red folder release time. I am very busy in morning so it is not possible for me to post it in during NY session but if someone wants to use these levels then they have ...
Gold
- aahmad29 replied Feb 1, 2024
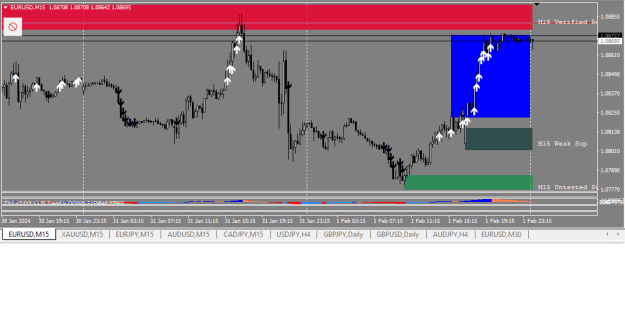
As per plan according to projection slope of jnevins , i stayed with Buy stop order. Blue rectangle area is my buy stop triggered and range.
Planetary Cycles Trading (EUR/USD)
- aahmad29 replied Jan 31, 2024
Price moved according to projection line. First it went down and then up. But as i mentioned that down slope of projection line is big slope so will stay with Sell Side. I forgot to post here but i always post in EURUSD thread. Here is my sell line ...
Planetary Cycles Trading (EUR/USD)
- aahmad29 replied Jan 29, 2024
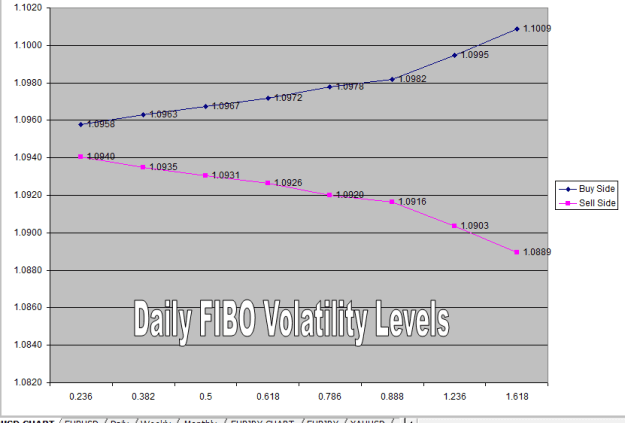
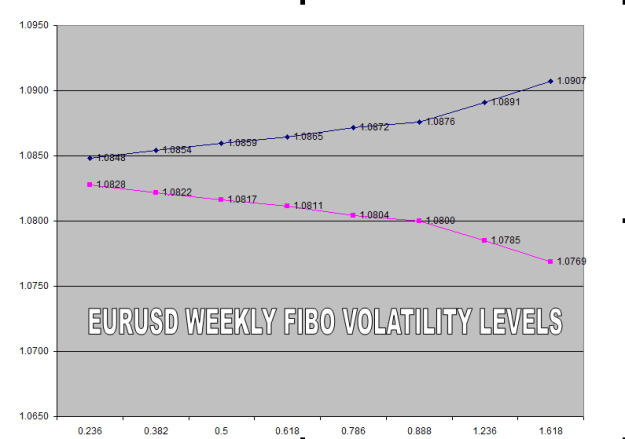
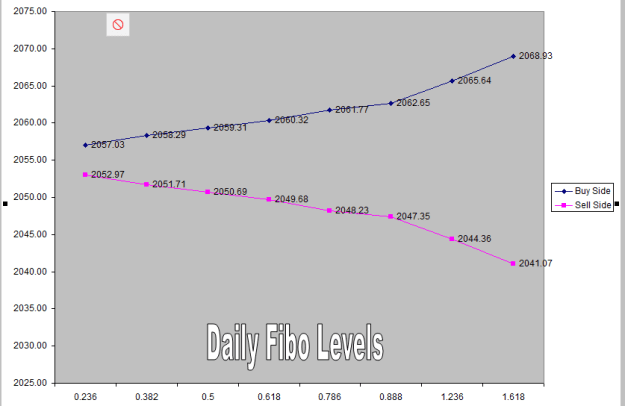
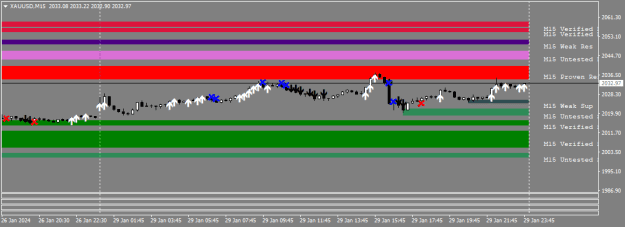
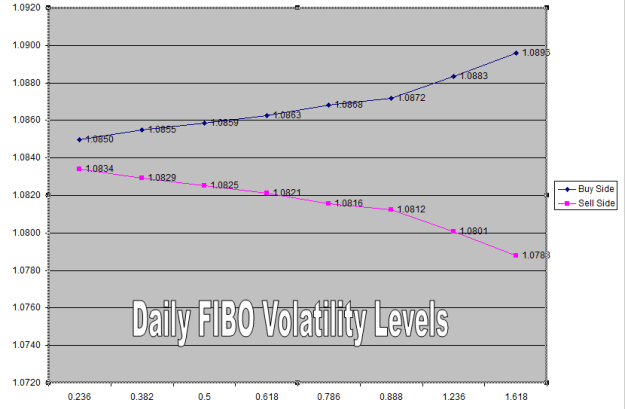
January 30, 2024 XAUUSD How to Use FIBO Volatility levels? Here is full detail with chart and pending orders. On the chart, there are two lines. Blue and Pink. Price levels on blue line are for Buy Stop order. Price levels on pink line are for Sell ...
Gold
- aahmad29 replied Jan 29, 2024
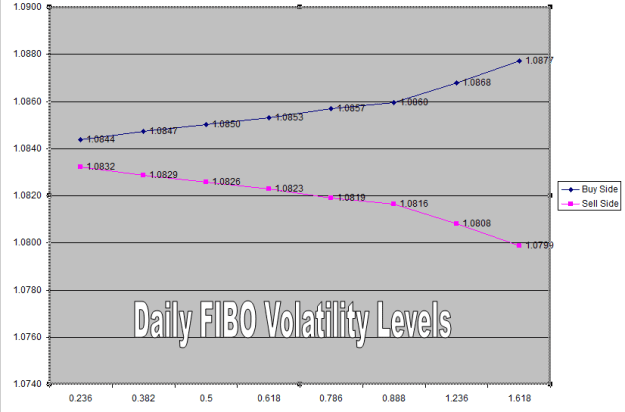
As i mention that projection line of jnevins is going down so i have to stick with pink line. Second position is running with SL at BE. My confirm final target is 1.236 (1.0801) and extended target is 1.618(1.0788)
Planetary Cycles Trading (EUR/USD)
- aahmad29 replied Jan 24, 2024
You are right. My Weekly FIBO levels are here. Sell side start with 2021. Do you consider daily candle close below 2020 as breakout?
Gold
- aahmad29 replied Jan 24, 2024
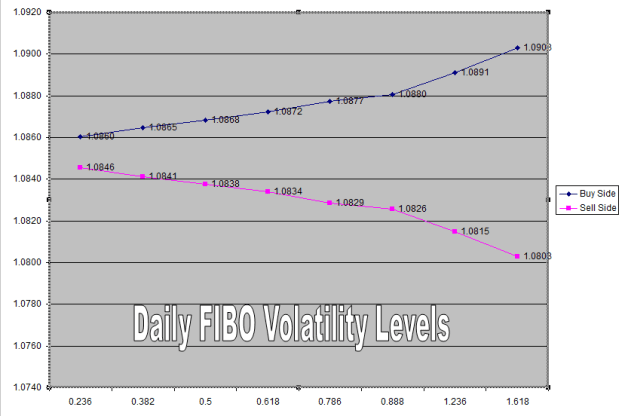
In other threads, i realized that many traders did not understand those pending orders so here is explanation. Here is full detail with chart and pending orders. This is example of my today's orders. On the chart, there are two lines. Blue and Pink. ...
EURUSD only
- aahmad29 replied Jan 24, 2024
Here is full detail with chart and pending orders. This is example of my today's orders. On the chart, there are two lines. Blue and Pink. Price levels on blue line are for Buy Stop order. Price levels on pink line are for Sell Stop order. Blue line ...
Gold

- aahmad29 replied Jan 24, 2024
I am sorry, initially i did not understand your question. I think you got confused about pending order where i only mentioned Fibo levels. My posted video is very short video and it contains only two documents. First it shows MSWORD document with ...
Gold
- aahmad29 replied Jan 14, 2024
My FIBO volatility levels for upcoming price movement. These levels are being used for targets and to exit position or to trade on the based of short term move with high volatility.
Planetary Cycles Trading (EUR/USD)