- Search Forex Factory
- 310 Results (3 Threads , 307 Replies )
-
 Igrok replied Jun 20, 2022
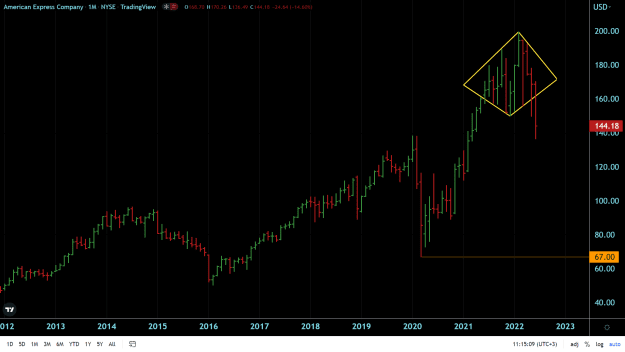
there are some additional indirect indicators in regards to DJIA future behavior... one of those is Amex charts... a smaller size diamond depicted here on the picture shows that there will be no correction on the DJIA till MOT at 67.00 level on Amex ...
The end of the US stock market is nearing
- Igrok replied May 28, 2022
my online trading courses... getting ready for yet another Great Depression 2.0 ...
The end of the US stock market is nearing
- Igrok replied Feb 26, 2022
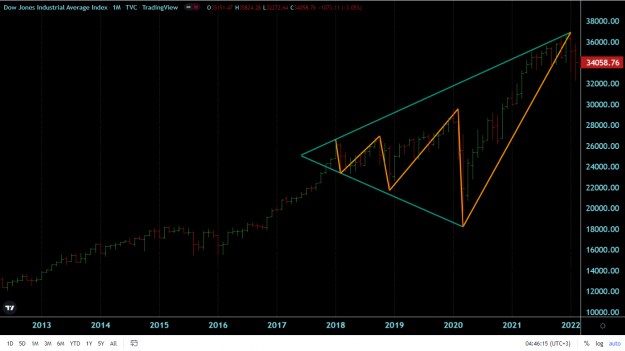
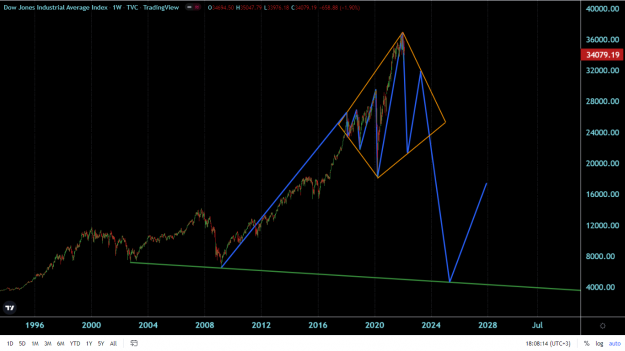
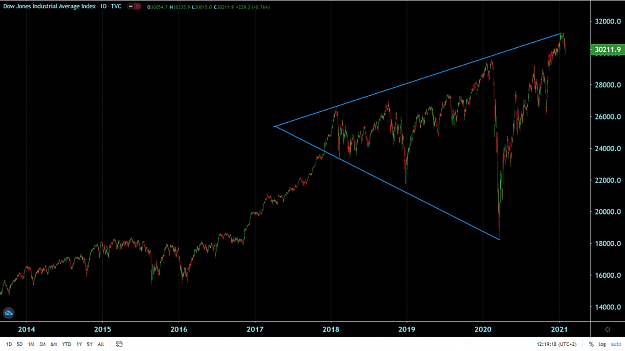
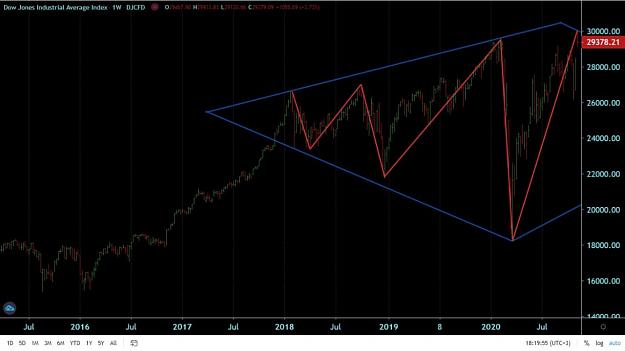
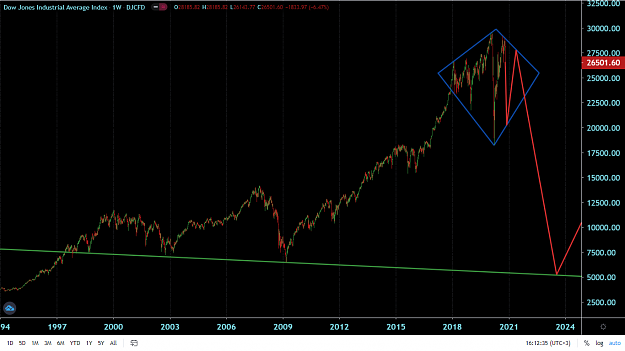
if to assume that DJI also will follow a similar scenario in the future , then we can expect to see a picture like the one posted below... of course that borders on the right part of the diamond are just projections now since we haven't seen those ...
The end of the US stock market is nearing

- Igrok replied Feb 26, 2022
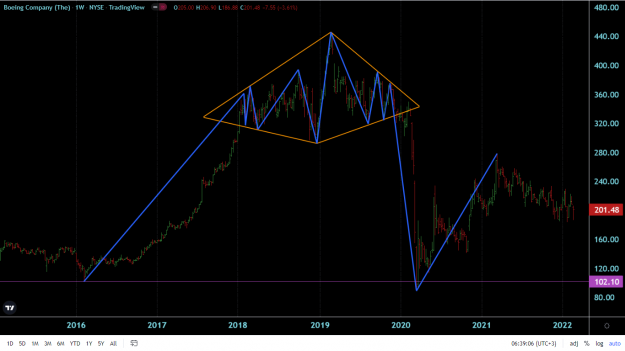
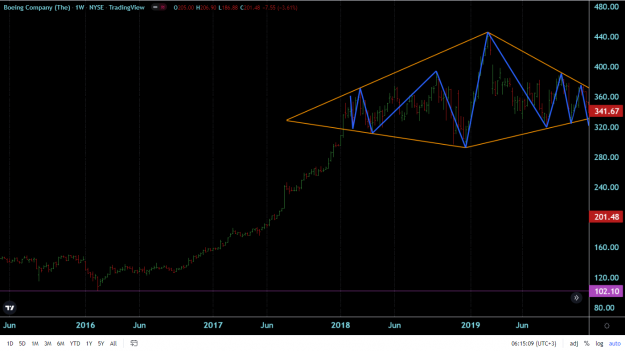
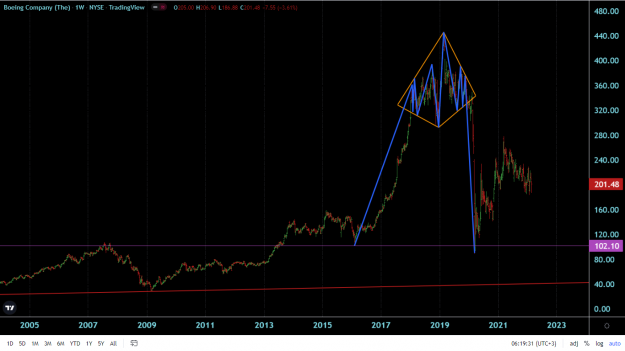
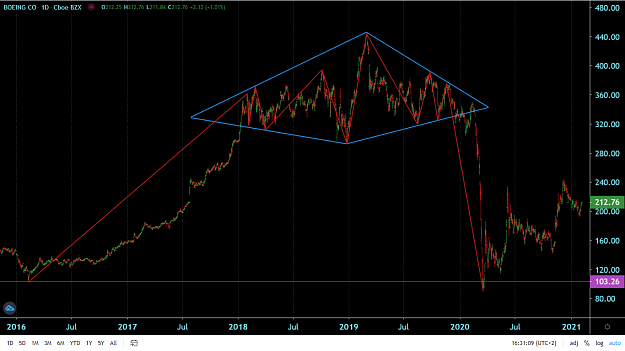
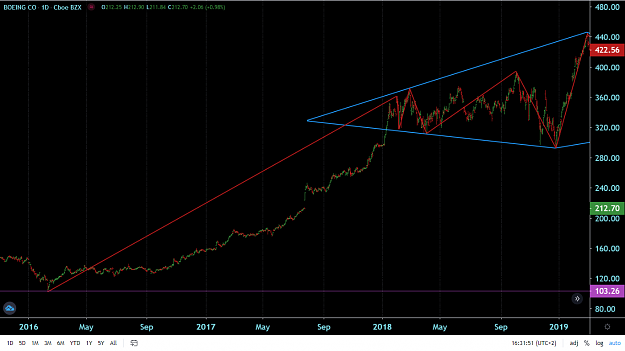
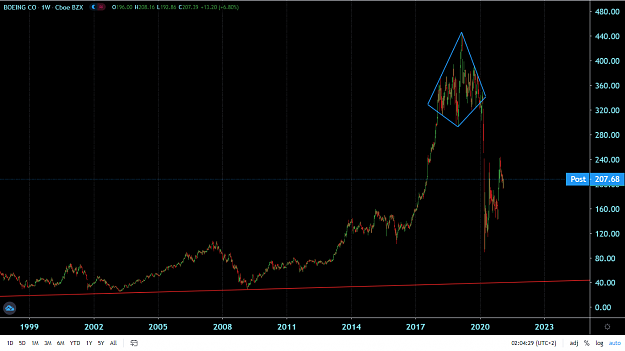
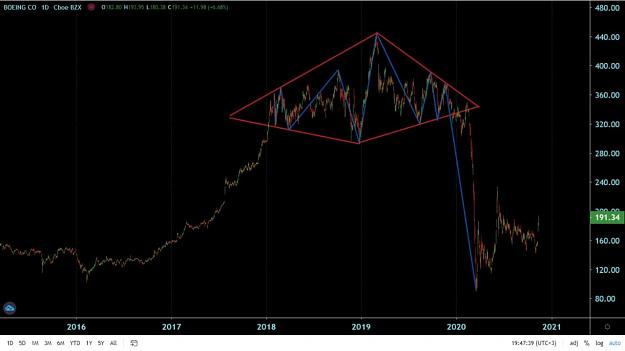
now let's what had happened to the Boeing Company (BA) chart... the second one first picture displays how the actual diamond got developed eventually.... the second one shows the whole history of a single-diagonal diamond being developed on the BA ...
The end of the US stock market is nearing
- Igrok replied Feb 26, 2022
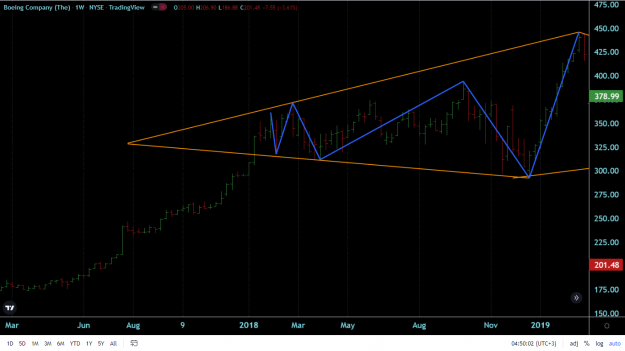
well, now let's get back to business... I'm unlikely to post everything at once, hence this post may be updated from time to time... first of all, as it appears, my assumption posted above was correct url from now on we can actually make a ...
The end of the US stock market is nearing
- Igrok replied Jan 24, 2022
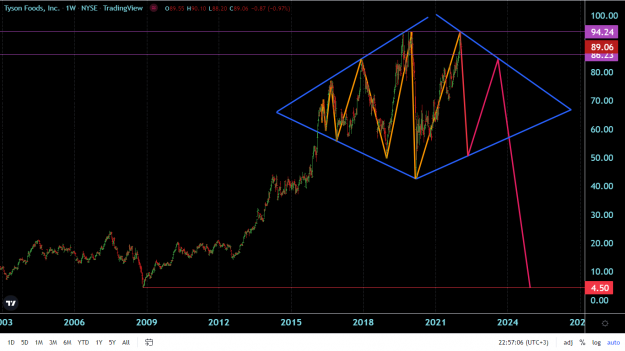
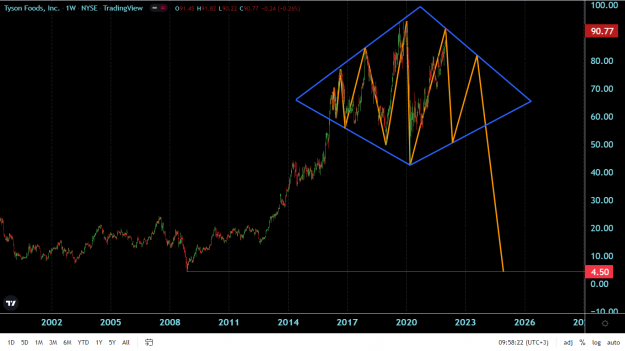
the second main diagonal of a potential dual-diagonal reversal diamond on Tyson Foods stock chart has been complete... the most probable future case scenario will be as shown on the picture... the chart can also be used as an indirect indicator for ...
The end of the US stock market is nearing
- Igrok replied Jan 24, 2022
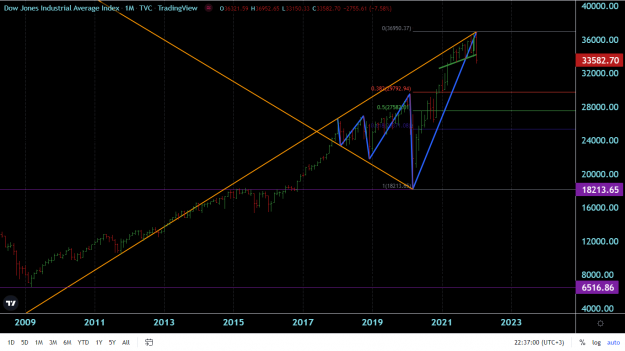
the chart implies that this time the DJIA is highly likely to bottom out initially ( but only temporarily!!! ) anywhere between 21300 and 23300... then we might see a more or less significant recovery towards 32000 level... though current historic ...
The end of the US stock market is nearing
- Igrok replied Jan 11, 2022
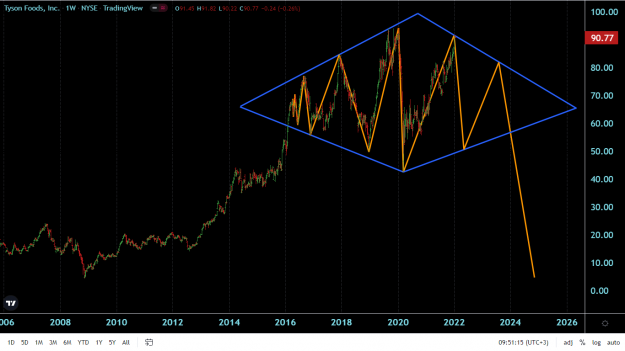
here is yet another potential reversal diamond in progress on the Tyson Foods stock weekly chart... it confirmed it may be used as a reference indicator for the major US stock market indices such as DJIA and S&P by extrapolation... in such a ...
The end of the US stock market is nearing
- Igrok replied Feb 5, 2021
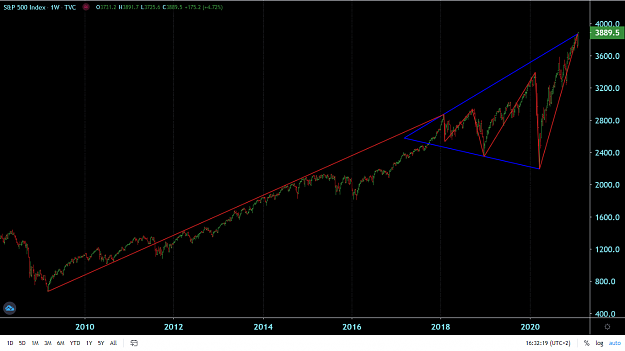
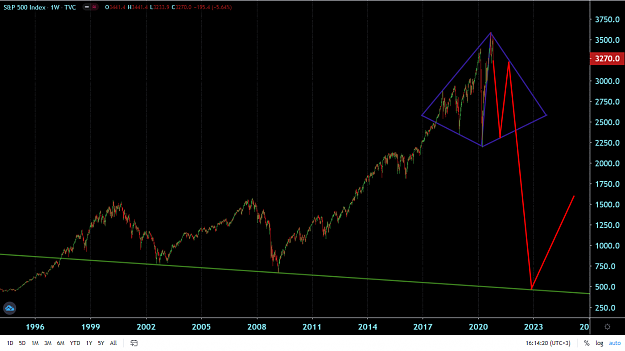
here we go again... let's compare side by side a fully developed diamond on the Boeing charts with what's going on right now on the S&P chart... first picture is a confirmed reversal diamond on Boeing... once fully formed this stock price turned ...
The end of the US stock market is nearing
- Igrok replied Feb 3, 2021
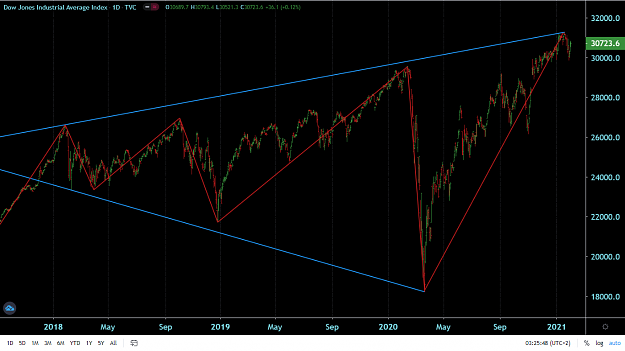
I doubt it... no time for such a BS has left as it seems... now let's compare that past diamond on Boeing charts (only its left broadening part) with current picture on the DJI chart...as we can see, so far both graphs look almost identical... since ...
The end of the US stock market is nearing
- Igrok replied Feb 3, 2021
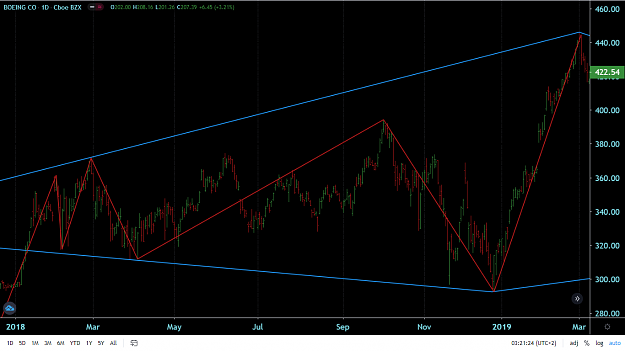
now let's get back to out business as usual... here is the illustration how a reversal single-diagonal diamond on the Boeing weekly charts looked like and how it reached its initial MOT ( measured objective target)... the red line at the bottom of ...
The end of the US stock market is nearing
- Igrok replied Feb 2, 2021
the only possible and legit diamond scenario can now be seen on the DJI chart... at this moment it's too early to call it but it may turn into a diamond eventually... from my perspective it has a good chance to do just that later on... at least we ...
The end of the US stock market is nearing
- Igrok replied Jan 29, 2021
{ information deleted by staff, per membership policy }
The end of the US stock market is nearing
- Igrok replied Nov 10, 2020
fresh example of this year... it's a diamond on Boeing stock chart... same thing here... six broadening waives come first and then a narrowing triangular pattern built to complete the diamond... previous up trend was fully covered after exiting the ...
The end of the US stock market is nearing
- Igrok replied Nov 10, 2020
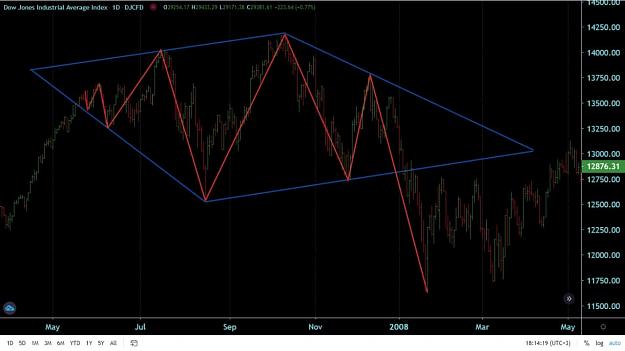
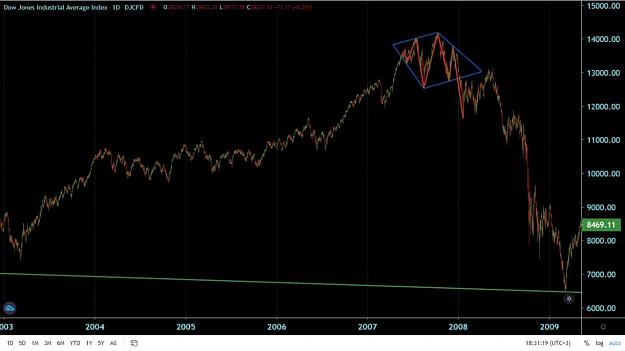
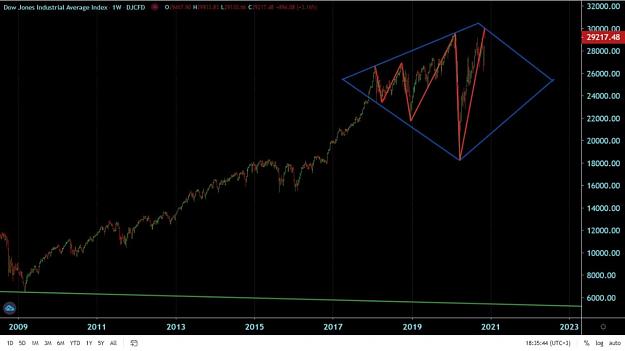
1. This is how a reversal diamond on the Dow looked liked before 2008 crisis. Six broadening waives and then a couple of the narrowing ones. The breakout took place to the downside with the ninth wave. 2. This is how the Dow chart looks like right ...
The end of the US stock market is nearing
- Igrok replied Nov 2, 2020
it doesn't really matter who will become the president and how... the outcome of those elections will not be able to change anything in regards to the markets... on a bigger picture those are the most probable scenarios for DJI and S&P... and in any ...
The end of the US stock market is nearing
- Igrok replied Sep 22, 2020
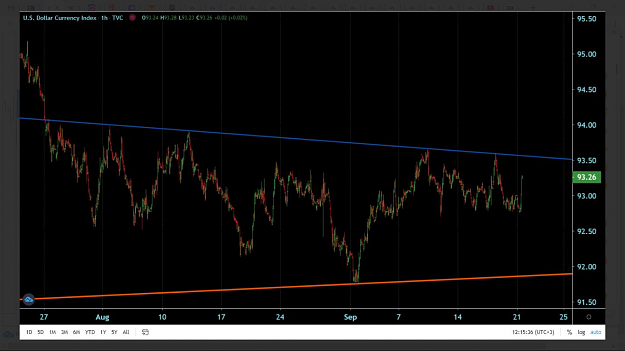
no, it's not a diamond... yesterday I first posted this picture on our telegram channel saying that the upper blue line is a magnet and will be reached and broken no matter what... it actually happened then later in the day...
The end of the US stock market is nearing
- Igrok replied Sep 2, 2020
it's a long shot to make such an assumption at this time but it's still possible, I guess... it's not going to cancel the fact that 1.35 will stand to play its role as a magnet and a level of attraction (which will be reached eventually no matter ...
The end of the US stock market is nearing
- Igrok replied Sep 2, 2020
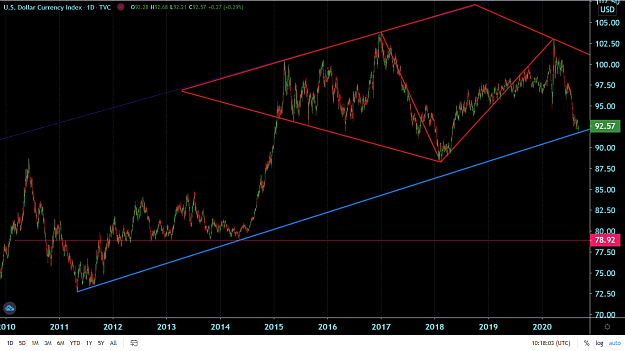
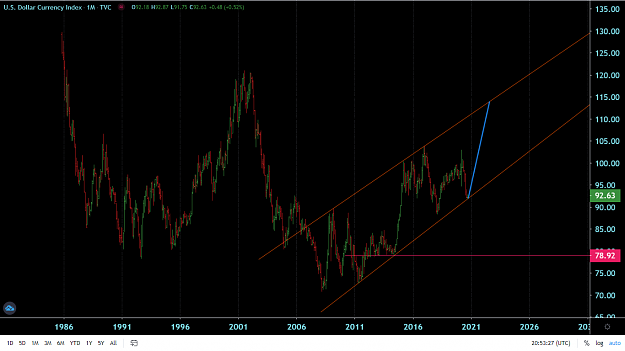
the eur/usd chart above corresponds well with the longer-term USDX chart... here on DXY we can see that the initial longer-term supportive line ( blue one here) held so far and the market is currently bouncing from it... at some point it might turn ...
The end of the US stock market is nearing