- Search Forex Factory
- 576 Results (2 Threads, 574 Replies)
-
 Shabs19 replied May 22, 2024
The Marketmakers & Professional Traders like to trap traders often at the Market Opens, to provide them with the liquidity for their positions. I find the best opportunities are between Franky & London Opens where the set-ups often occur. You just ...
Flying Dutchman

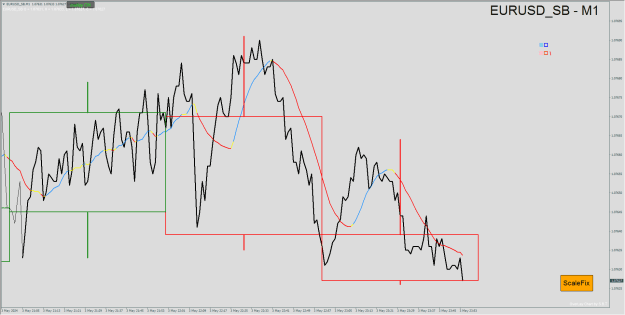
- Shabs19 replied May 4, 2024
A workaround by starting with M1 Line Chart then superimposing MA15 to represent the M15 Line Chart and finally M-Candles H1 to frame it all. image
Line Chart indicator for same currency with multiple timeline
- Shabs19 replied Apr 8, 2024
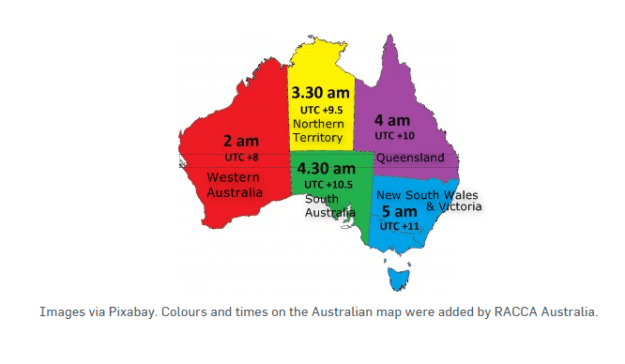
image Is it me or do I see a Dog's head facing one way & a Cat's head facing the other way, on the Aussie Map ?
Flying Dutchman
- Shabs19 replied Apr 5, 2024
image We made our own, out of scrap wood and Pram Wheels and nicking Dad's tools. No Health & Safety, nothing a bit of dettol wouldn't cure, in case of accidents.
Flying Dutchman

- Shabs19 replied Apr 1, 2024
url Beauty is in the eye of the beholder or the scientist ? image image
Looking for Fibo Numbers


- Shabs19 replied Mar 31, 2024
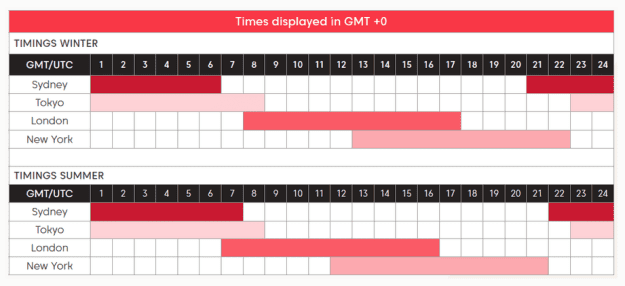
OMG............. But I thought AUS didn't do DST , so some states do & some don't ? Problem is it messes up with your charts if you are trading around the market opens. I know Japan got rid of DST a long time ago. This may be useful if you are from ...
Flying Dutchman
- Shabs19 replied Mar 28, 2024
Do you want to see a current D1 candle in chart window, whatever TF you select ? Not sure what you are asking for, something like this : image
I will code your EAs and Indicators for no charge
- Shabs19 replied Mar 27, 2024
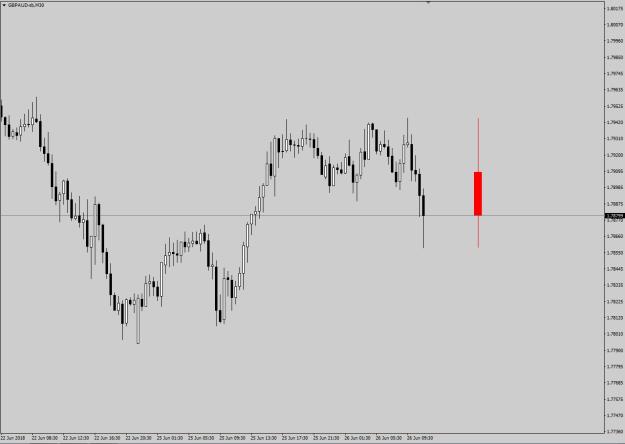
Of course on lower timeframes you could look at the small accumulation zone & spring that sent the prices higher in todays asia session which was then wiped out clean in one 5m bar, was it really what someone said something or was it all pre-planned ...
Flying Dutchman
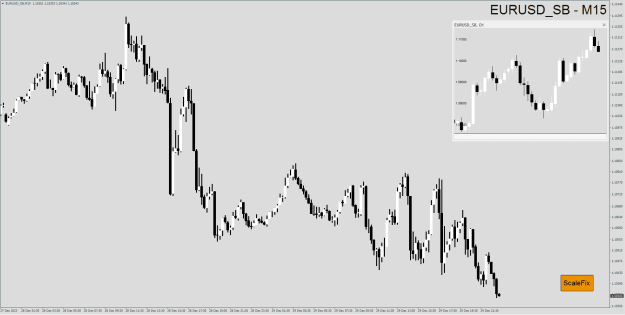
- Shabs19 replied Mar 24, 2024
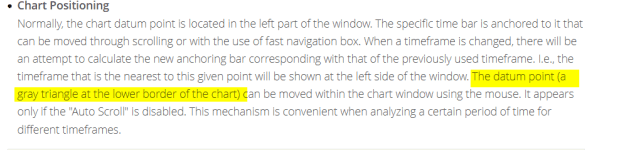
No, I am afraid he is correct, there is a small triangle at the bottom left near the price scale when autoscroll is in off position. It is called a chart datum point. The upper right arrow controls the shift to the right and I am assuming the bottom ...
how to lock the date/candle when changing timeframes?

- Shabs19 replied Mar 20, 2024
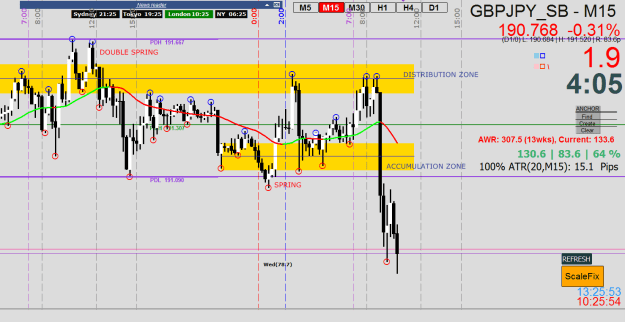
image BOJ opened the floodgates and panic set in, London Open swept up all the Sell Orders , the "grinding" (Profit taking by Tokyo traders).
Flying Dutchman
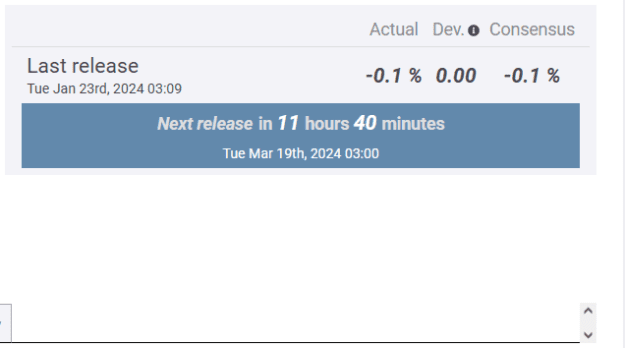
- Shabs19 replied Mar 18, 2024
During the Asia session @ 3:00 am UK url image
MTF Engulf / Engulf fail


- Shabs19 replied Dec 29, 2023
I have come across an MT4 broker that has this type of indicator that does work on MT4, the chart has many extra features than a normal chart, such as non standard timeframes, chart types such as Tick charts, Point & Figure, renko etc. So it is ...
I will code your EAs and Indicators for no charge
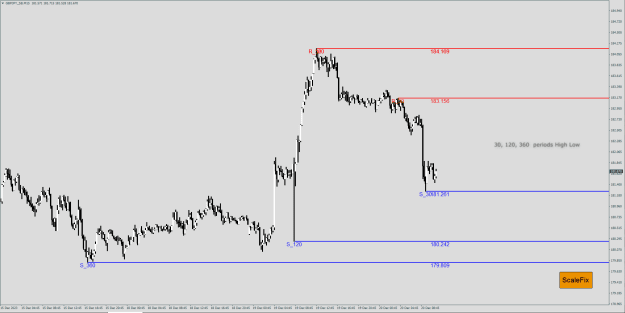
- Shabs19 replied Dec 20, 2023
Maybe this indicator might help ? Adjustable number of periods for High Low Lines with Prices. image file
I will code your EAs and Indicators for no charge