- Search Forex Factory
- 379 Results (3 Threads , 376 Replies )
-
 Starry replied Sep 10, 2021
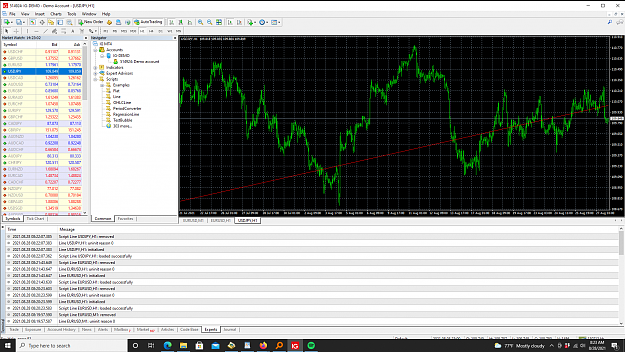
After playing around with it , I feel that using two linear regression lines (20 and 200 bars) is better as a visual aid. Its the best linear regression can do as a visual aid. It usually forms an x on the visible chart , maybe that's why there's an ...
Regression Ray for Metatrader 4
- Starry replied Aug 28, 2021
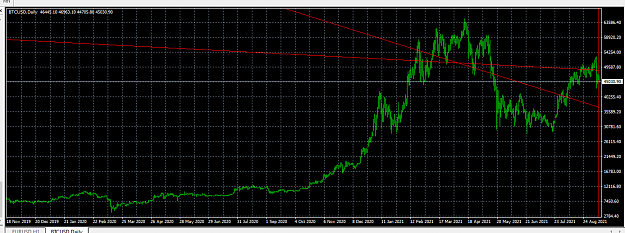
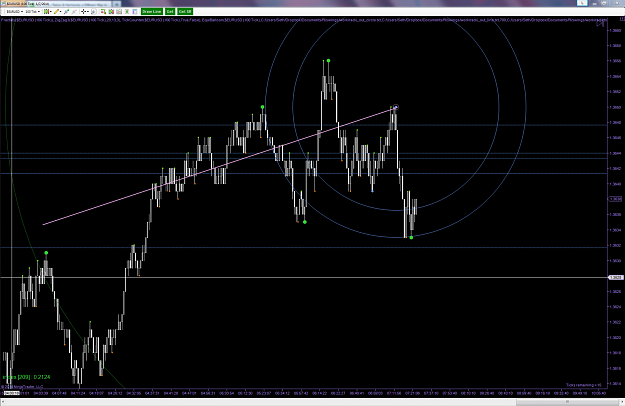
Here's a version which draw a regression line from bar 0 to bar 199. Its just a one time visual indicator of market bias. Then you can guess , or estimate once you get practice , which direction the market will go in , i guess!
Regression Ray for Metatrader 4
- Starry replied Feb 27, 2014
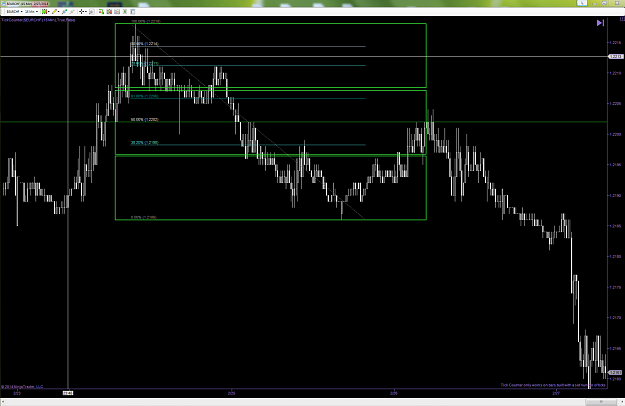
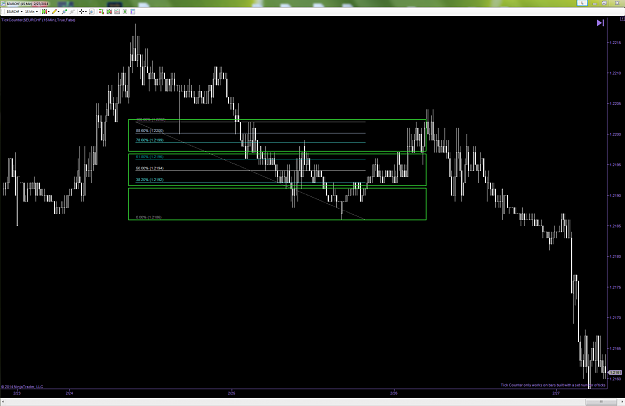
For example, here is a swing which i have divided into thirds. Then, i divided the 50% retracement into thirds. Its my intuition that the places where price pauses in relation to the third boxes are important in determining order flow. You can also ...
Ratios & Harmonics: a Different Way to Trade
- Starry replied Jan 22, 2014
short to lower zone? edit: woops forgot to wait for price action.. still im getting better at drawing these support zones.
Ratios & Harmonics: a Different Way to Trade
- Starry replied Jan 17, 2014
Troopers brought in ~22 pips today, I had a 2 pip loss i dont show (i was temporary confused on my expectations for the long-term order flow)
Ratios & Harmonics: a Different Way to Trade image
image
- Starry replied Jan 9, 2014
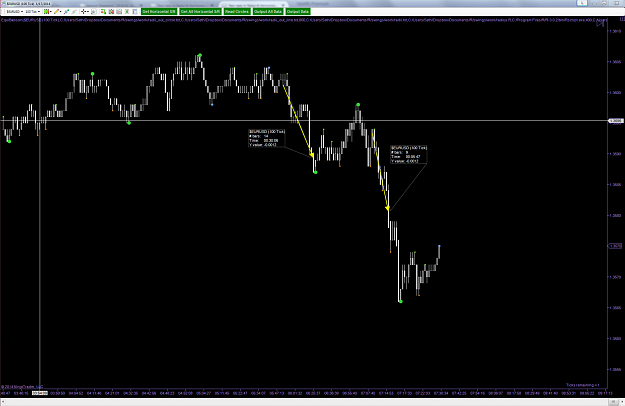
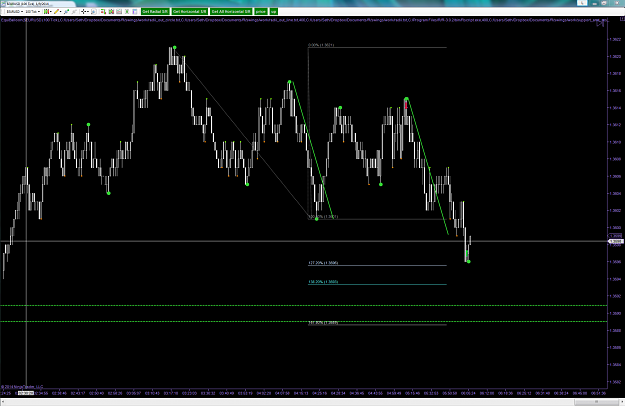
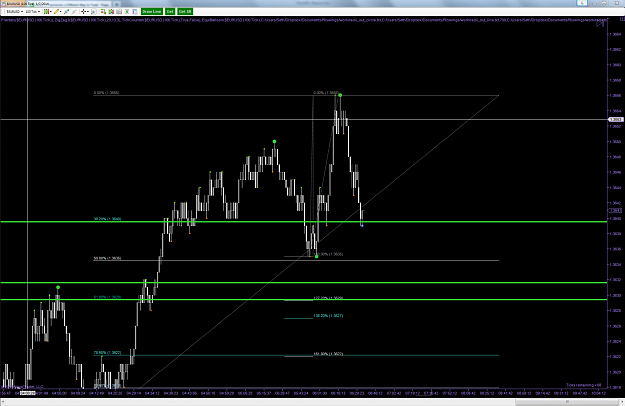
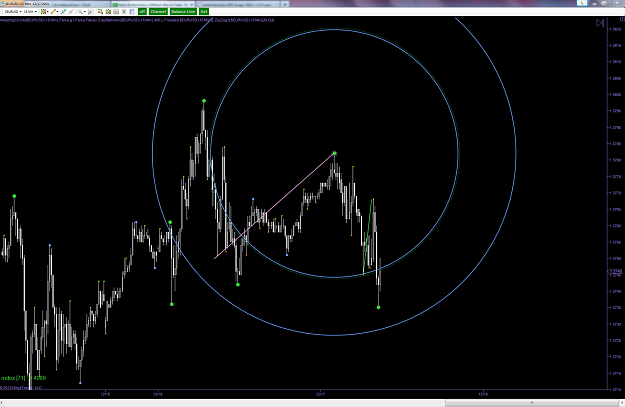
Current short eurusd. Expectations 100 tick - long-term order flow: down short-term order flow: down 15 minute - long-term order flow: up short-term order flow: down Take Profit ~ 50% on 15 minute, at 1.3589 edit: moved to break even @ 1.3610. ...
Ratios & Harmonics: a Different Way to Trade
- Starry replied Jan 7, 2014
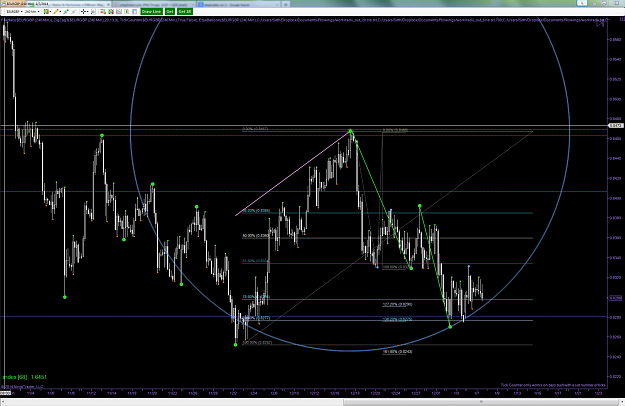
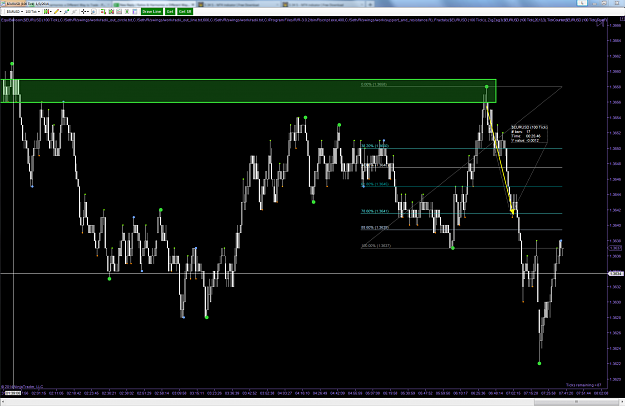
I see some confluence and a support line, so I think it would be risky for me to take. On the other hand, we have a weak retracement and then a deep projection on larger momentum, so this indicates bearish action. However, bears seem to have failed ...
Ratios & Harmonics: a Different Way to Trade
- Starry replied Jan 7, 2014
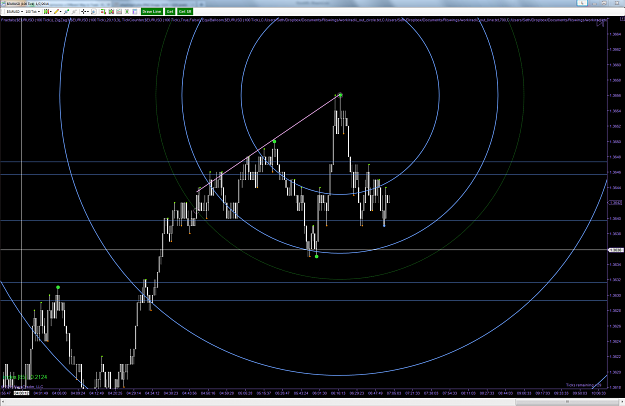
Took profit in middle of circle. Even though my expectation is down for the order-flow on the 15m, i expect it wil lbe wavy on the tick chart, perhaps. image
Ratios & Harmonics: a Different Way to Trade
- Starry replied Jan 7, 2014
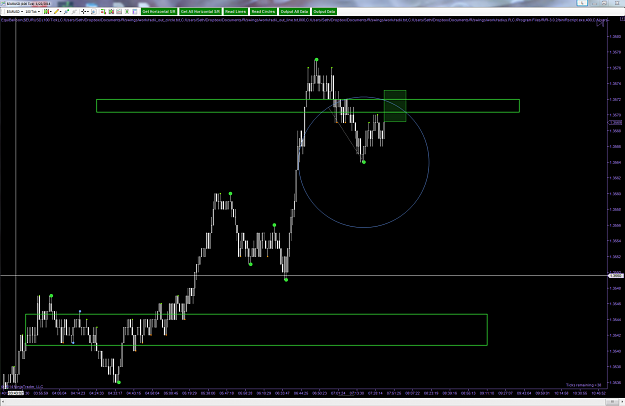
Heres my horizontal sr levels, ignore the circle ones. Price bounced off the upper ones. image
Ratios & Harmonics: a Different Way to Trade
- Starry replied Jan 7, 2014
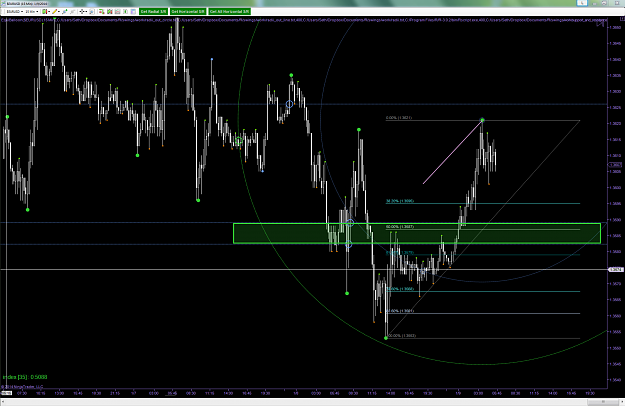
Short from the top, take profit at 61.8. short term order-flow down on 15m, price is currently at a s/r level and it may take me out, but I am at break even, so its risk free. image
Ratios & Harmonics: a Different Way to Trade
- Starry replied Jan 3, 2014
12 pips from todays battle. image
Ratios & Harmonics: a Different Way to Trade
- Starry replied Dec 30, 2013
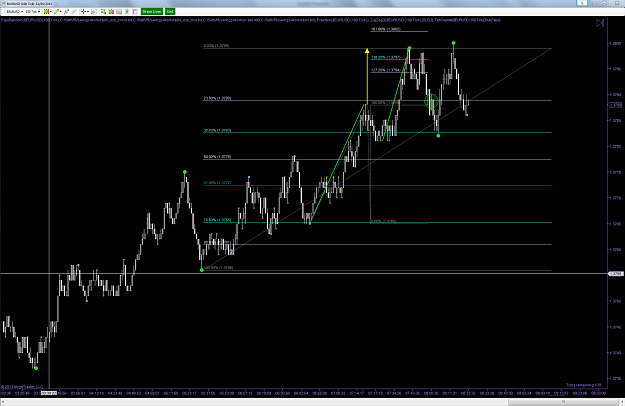
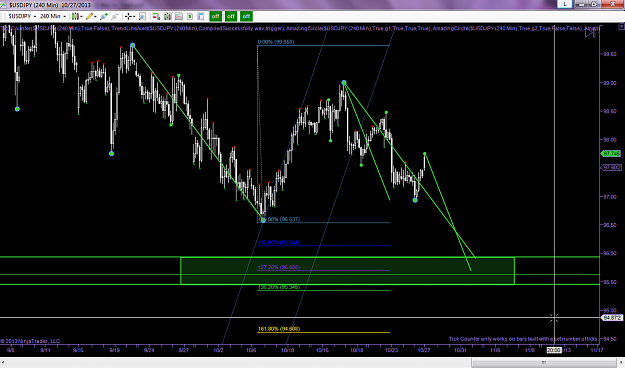
Hello, Im working on order flow expectations. We have a large projection, and I expected to see a shallow retracement. However, since I suspected the long-term order flow was breaking down, I also expected that we may see a deeper retracement. We ...
Ratios & Harmonics: a Different Way to Trade
- Starry replied Dec 17, 2013
I got stopped out on the exact same trade. I entered almost at the very top , and I moved to break even when it reached the 38.2% (on 100 tick chart). Price would have only moved against me by 1 pip, and then it dropped 30 pips. My conclusion is ...
Ratios & Harmonics: a Different Way to Trade
- Starry replied Nov 17, 2013
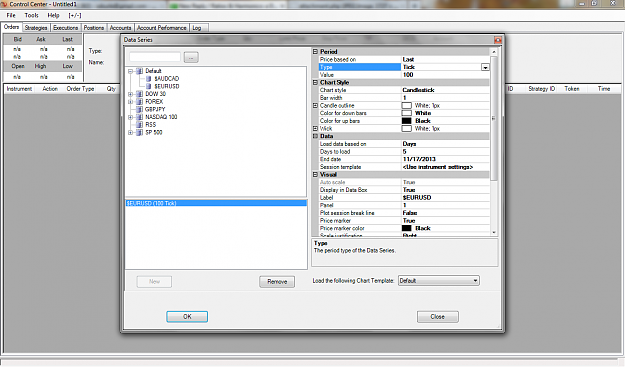
He uses ninjatrader, and its a default chart type. Unfortunately, metatrader does not contain this charting type. You cant convert time frame charts into tick charts, because one tick is one change in quote price, so its simply impossible because ...
Ratios & Harmonics: a Different Way to Trade
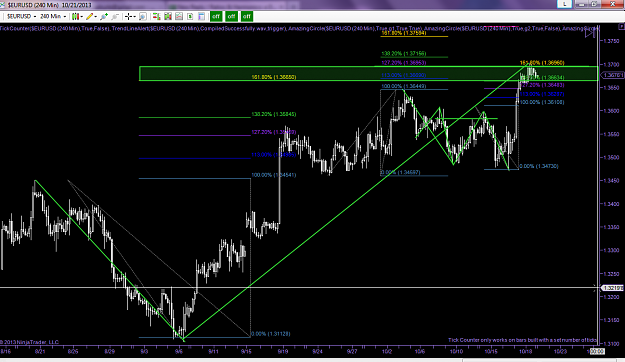
- Starry replied Oct 21, 2013
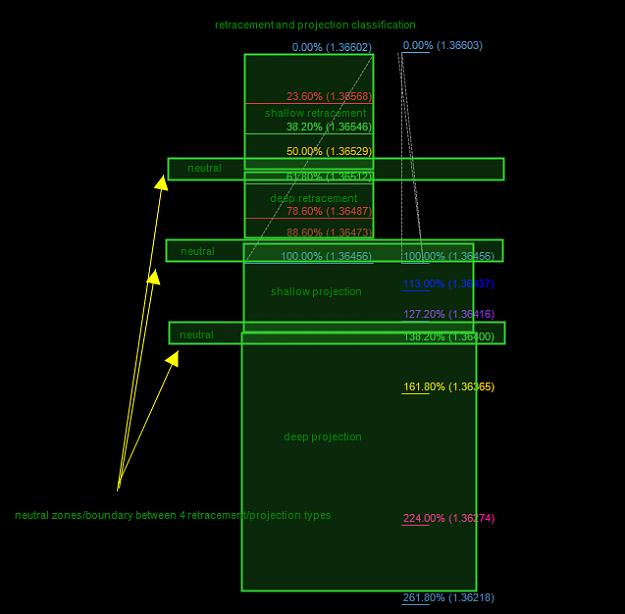
Heres a pdf of the 6 common combinations (hey im assuming im right already
Ratios & Harmonics: a Different Way to Trade ) If you have a swing that was a certain type of projection or retracement, you can try to predict the outcome by looking for that type of projection/retracement in the ...
- Starry replied Oct 20, 2013
Looks like a PRZ too me, and maybe the top of a large swing. Got a shark at the very top
Ratios & Harmonics: a Different Way to Trade image
- Starry replied Oct 20, 2013
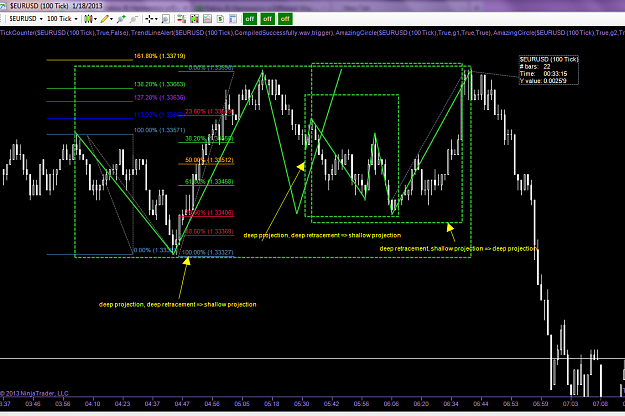
I have cobbled together some results and have put it to a practical use (analyzing one of mr pips trades). Admittedly i only based the results on all of the days mr pip traded and posted, but i think its still valid. 6 common combinations deep ...
Ratios & Harmonics: a Different Way to Trade
- Starry replied Oct 20, 2013
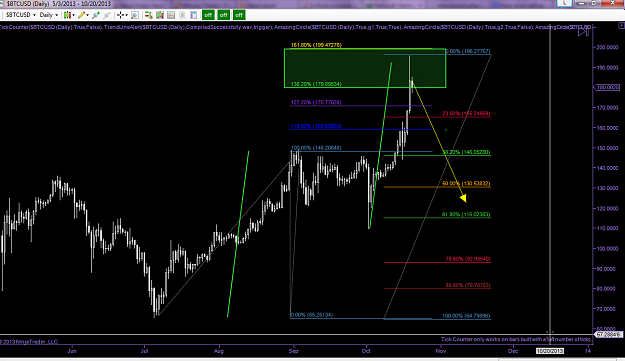
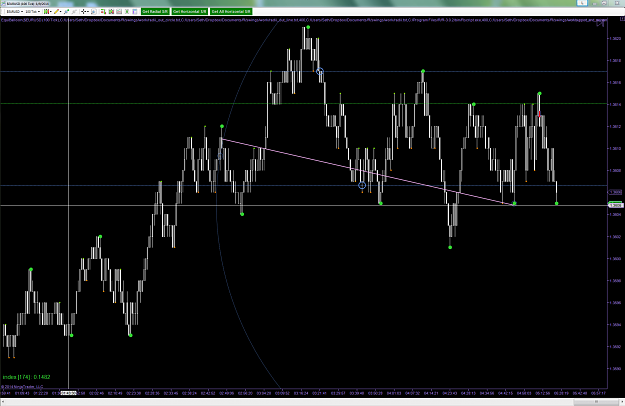
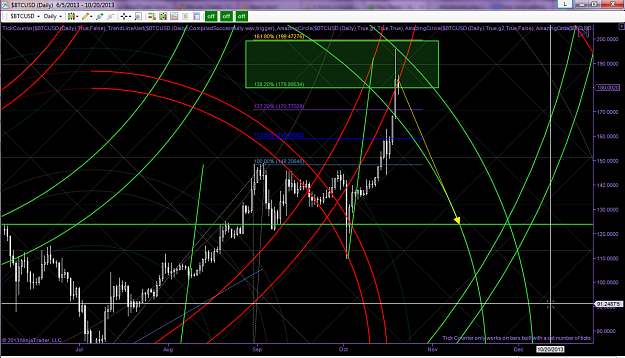
BITCOIN IS BEARISH! well at least it has reached a harmonic completion point. But hey, at least its starting to look like a normal currency pair (well a volatile one, but normally volatile like the japanese pairs) Good thing I can analyze charts so ...
AmazingCircle Trading Tool
- Starry replied Oct 20, 2013
Just for fun: heres a bitcoin vs usd chart (i imported it from raw online data, so its not live)! where will it go
Ratios & Harmonics: a Different Way to Trade edit: hey, its at a harmonic completion ab = cd. most likely bearish with the quick acceleration at the end there. target ...