- Search Forex Factory
- 32 Results (1 Thread , 31 Replies )
- spiritbreezer replied Jul 27, 2012
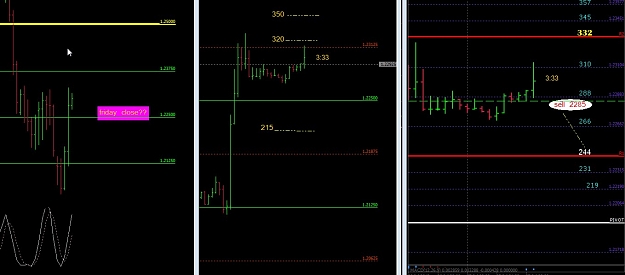
Friday down day — I suspect euro will close today around 1.2250. I see it as traders who are in the long, might just for risk aversion close for a profit as USA opens. So I have placed a sell at 1.2285 with the R1 as target, 2244.
EurAnalysis
- spiritbreezer replied Jul 26, 2012
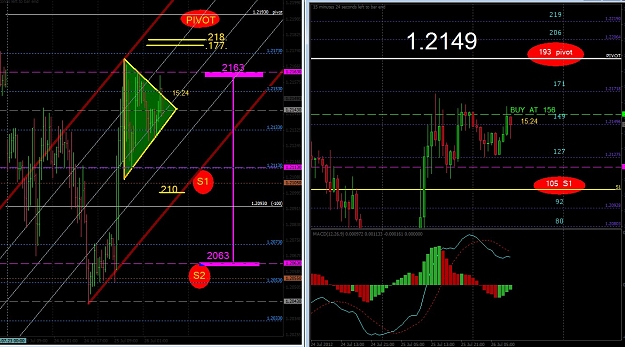
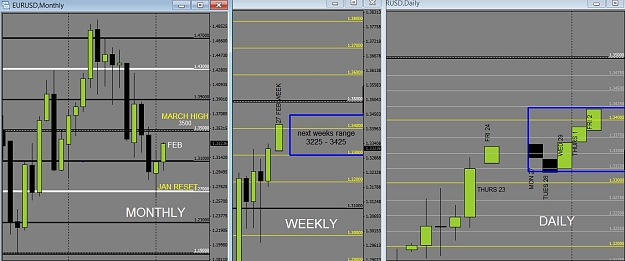
ONE MORE MOVE UP — So euro bounced off weekly supp 2 and broke 2063 to move 100 pips up to 2163. We still have one more move up to the pivot at 6193, with resistance levels at 2177 and 2180. These 2 levels will be looked at to short when when ...
EurAnalysis
- spiritbreezer replied Jul 24, 2012
Reversal? — I've closed my short from 1.2087 at 1.2089 fro a loss of -2. I've been doing some reading on website, cannot find it now (i right click open in new tab so many google websites). Trend is down, but there has to be a correction to ...
EURUSD
- spiritbreezer replied Jul 3, 2012
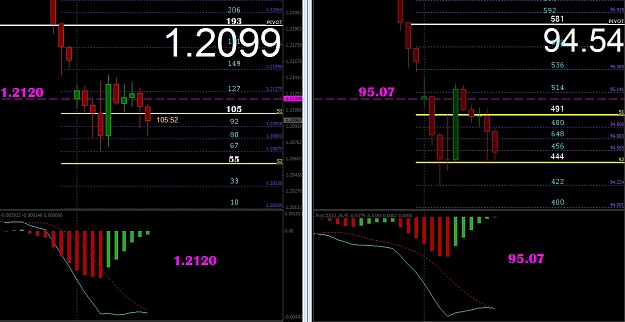
Selling AT 100.49 — I'm looking for euryen to drop to 94.45
EUR/JPY Trading Room

- spiritbreezer replied Feb 23, 2012
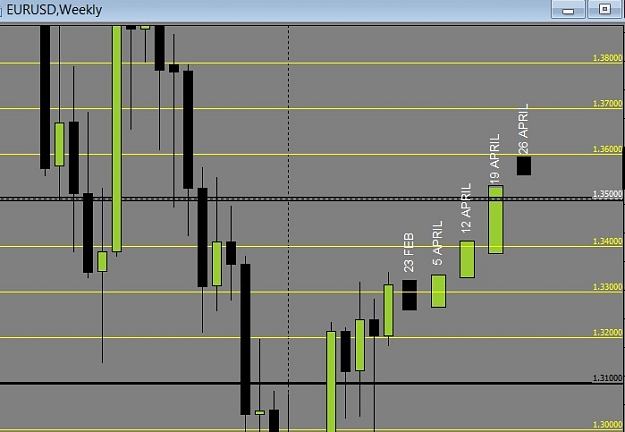
macd — Something interesting I've just noticed yeah. If you take a monthly chart, and apply macd 5-13-2 to it, then the March of every year, back to 1992, has it's macd go in the same direction as that of February. And if February macd stops ...
EURUSD
- spiritbreezer replied Feb 23, 2012
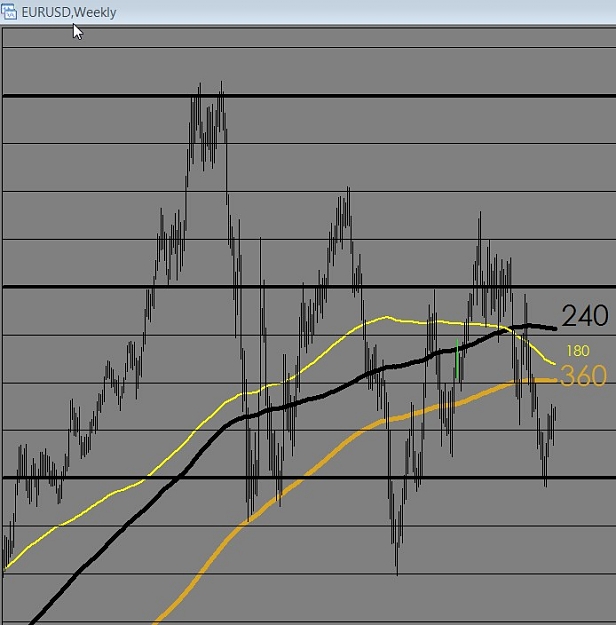
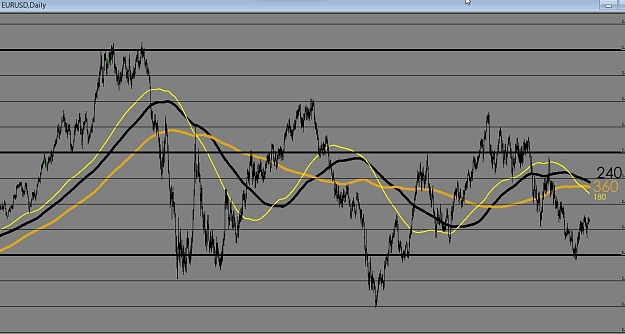
I don't use moving averages, but had a look at charts using some. I just used the 360/240 and 180. The first chart is weekly, showing that 180 has crossed the 240 downwards, and that the 240 and 360 seems to be stalling. What's really interesting is ...
EurAnalysis
- spiritbreezer replied Feb 10, 2011
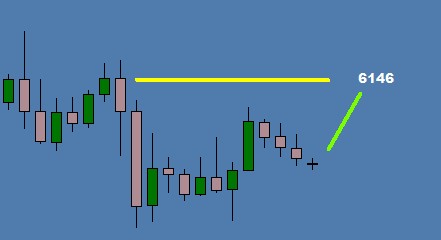
6146 — as soon as 30min chart gives buy signal, i'm in long ( probably at 6086) with target 6146 as per attachment. could be next (8:30am) candle already.
Cable Update (GBPUSD)
- spiritbreezer replied Jan 5, 2011
adding — For those not in a long trade yet. I will be adding to my long and buying at 4596 to 5634
Cable Update (GBPUSD)
- spiritbreezer replied Jan 5, 2011
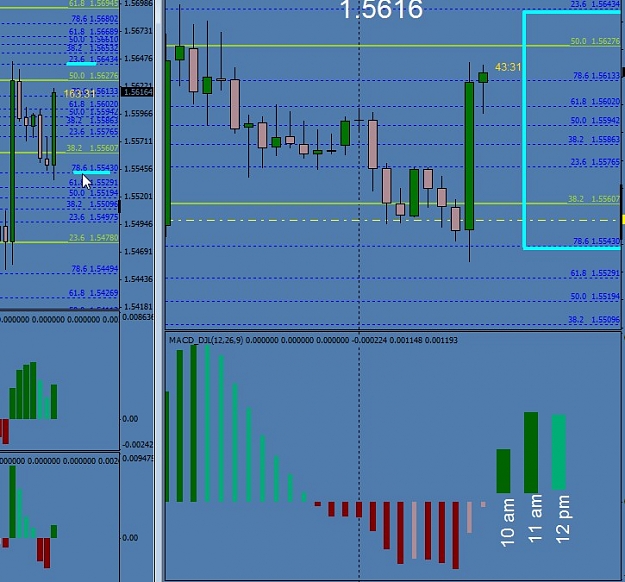
100 pip move — This is a 4hr chart then a 1hr chart. Cable likes to setup a 100 pip move everyday at London open. Well we had the setup at 15543. The chart on the right shows with blue, the 100 pip block, right up to 5643. Now at the bottom of ...
Cable Update (GBPUSD)
- spiritbreezer replied Jan 5, 2011
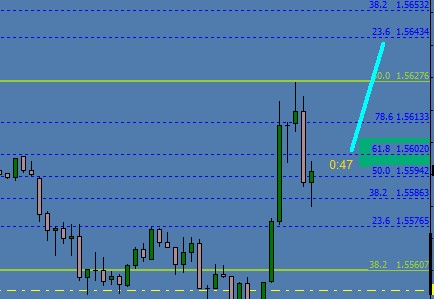
Upwards — Ok, cable closed between 5620 and 5560 yesterday. I'm, still looking for cable to move up towards 5700 today. So will buy on break of 5576. This is a 4hr chart.
Cable Update (GBPUSD)
- spiritbreezer replied Jan 4, 2011
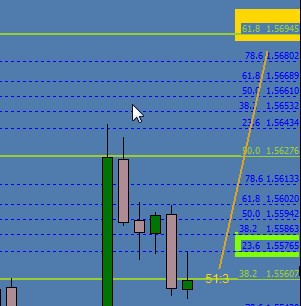
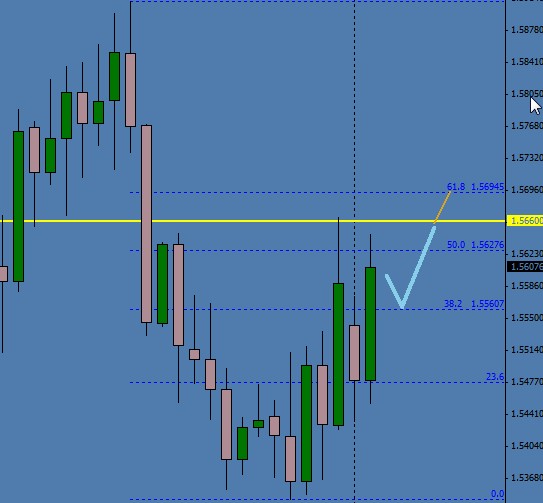
5700 — This is a daily chart. The dotted lines represent last months fibs. I reckon cable will close between 5627 and 5560 today. Tomorrow retrace to and bounce off 560 then move up to the yellow line at 5660. There it will show us weather ...
Cable Update (GBPUSD)
- spiritbreezer replied Nov 23, 2010
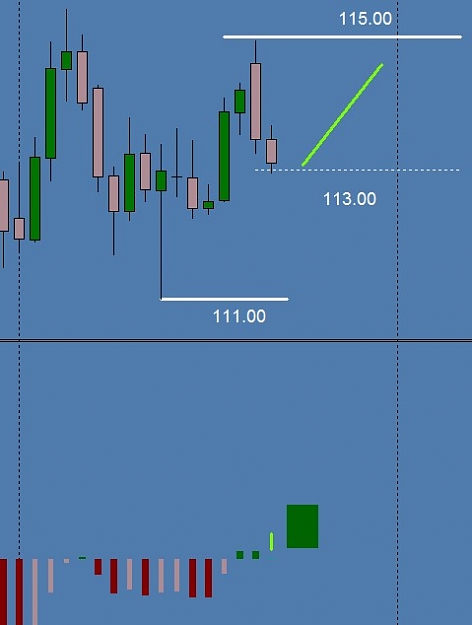
Bounce — Hi Glad i found this thread, I love euryen too. I see yesterday and today just as correcting for a higher move. Today should close here at the 113.00 level. And then I expect tomorrow to bounce off 112.60/75 and start a move back up ...
EUR/JPY Anytime!
- spiritbreezer replied Jun 25, 2010
Selling — I mentioned yesterday that I was looking for London to push cable down where I would buy and then push it up to a high, and then for the US to sell it back down. Cable came 5 pips shy of the high I wanted, and then late yesterday and ...
Cable Update (GBPUSD)
- spiritbreezer replied Jun 24, 2010
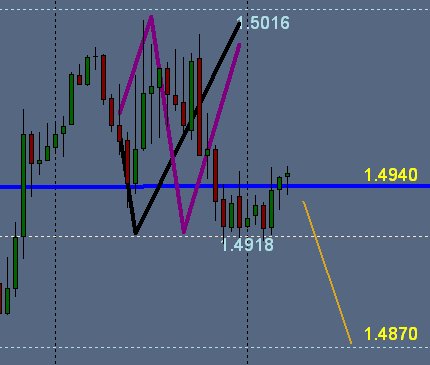
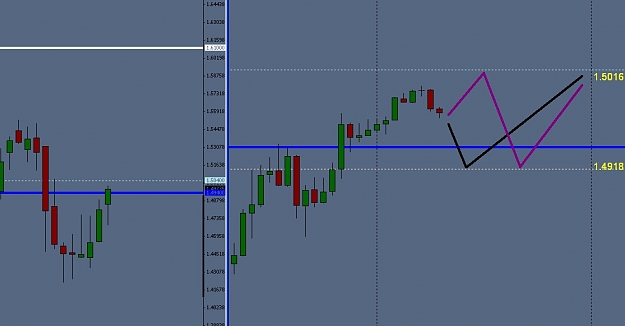
Weekly high — I presume cable high for the week to be 1.5016 Cable is making her way back up to 1.6100 in July, so to I expect London to push down to 4918, where i'll buy, then wait for US to open and reach the high 5016.
Cable Update (GBPUSD)
- spiritbreezer replied Mar 26, 2008
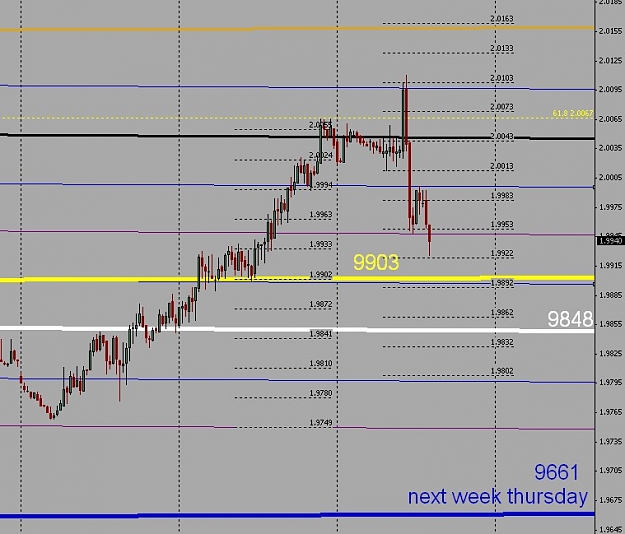
Still down — I mentioned yesterday that cable will have a high today then come back down. It's following nicely. Today should have a low of about 9903, then tomorrow will toy with the 9848 area. I still reckon we are the way to 9661 for next ...
Cable Update (GBPUSD)
- spiritbreezer replied Dec 17, 2007
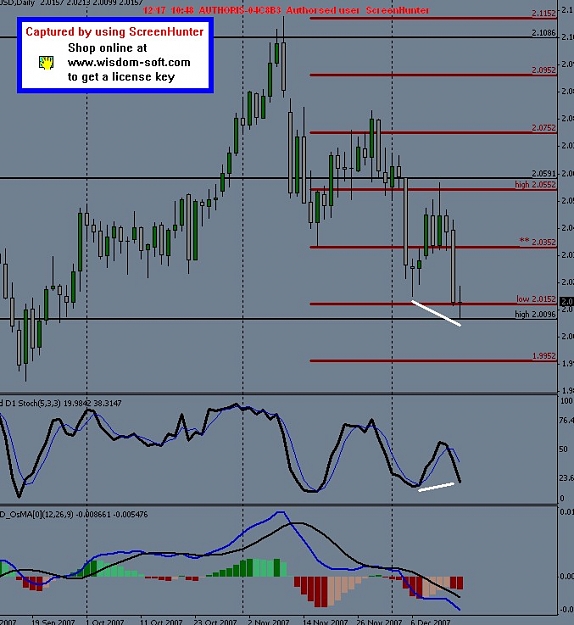
Cable day close above/below 2.0152 — If cable closes the day above 2.0152, it will show divergnce on stochastics. I suspect that the lowest it will go 2.0096 tomorrow then bounce back up. This low could be the start of a new slow rally ...
Cable Update (GBPUSD)
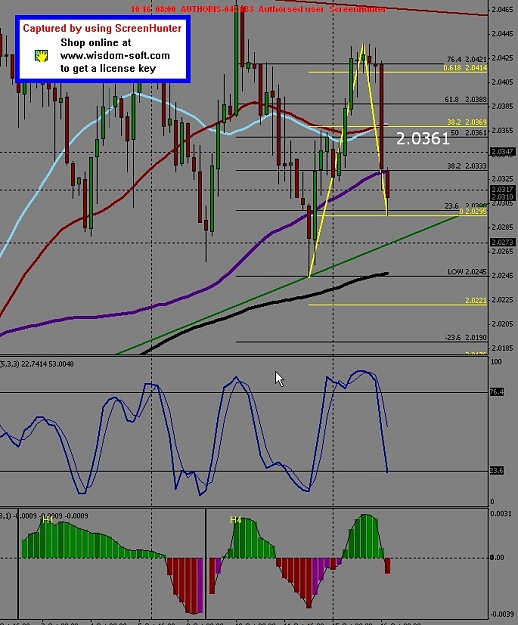
- spiritbreezer replied Oct 16, 2007
Cable trade — Ok, I have entered 3 lots long at cable at 2.0300 as mentioned earlier. I sdaid I wanted 60 pips on the first 2 lots. Looking at the 4hr chart, the fib ext 38.2 comes in at 2.0369 also being roughly the 4hr 50sma, so 60 pips ...
Cable Update (GBPUSD)
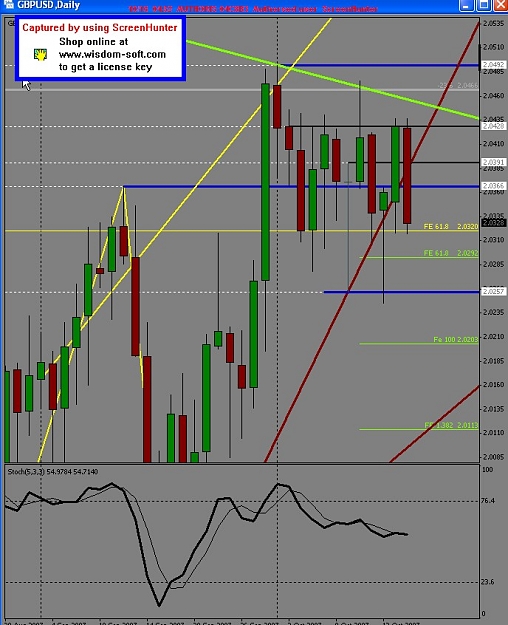
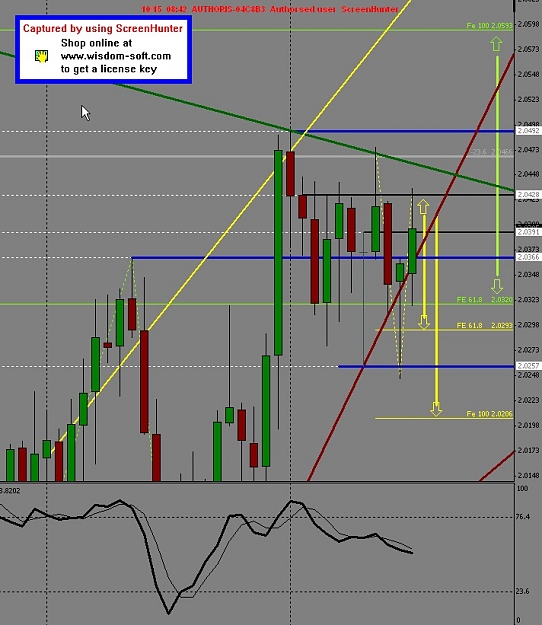
- spiritbreezer replied Oct 16, 2007
Closed at Target 1 — Ok, so I have closed my short from 2.0424 first target 2.0320 the 61.8 ext as mentioned yesterday. I took another short on the break of 2.0366. And seeing that it is such a long bear candle, I will to take a counter long ...
Cable Update (GBPUSD)
- spiritbreezer replied Oct 15, 2007
Reason — The reason I'm short is becasue if you have a look at the daily chart, you'll notice the daily stochastics is heading down. The 4hr and 1hr stochs have been heading up so are just waiting to turn over. Now what I did fail to spot this ...
Cable Update (GBPUSD)
- spiritbreezer replied Oct 15, 2007
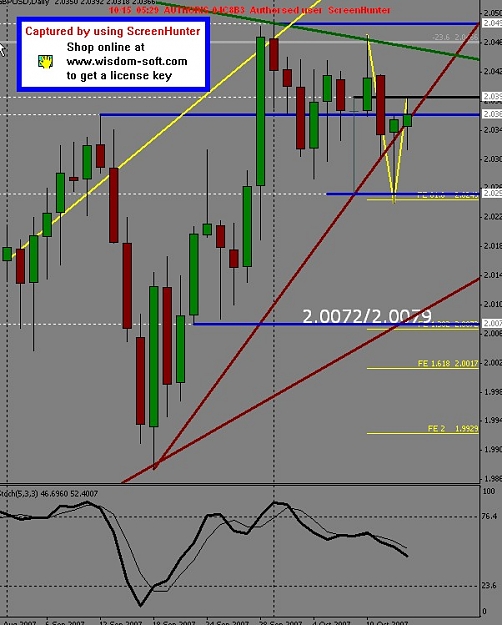
cable down to 2.0078ish — I took a short on cable from 2.0385 as it hit the high of 9 Oct at 2.03921, black line. The reqson for the short is because the daily stochs are heading down as you see in the pic below. Also the 4hr and 1hr stochs ...
Cable Update (GBPUSD)