- Search Forex Factory
- 15 Results (2 Threads , 13 Replies )
- PipRippy replied May 20, 2007
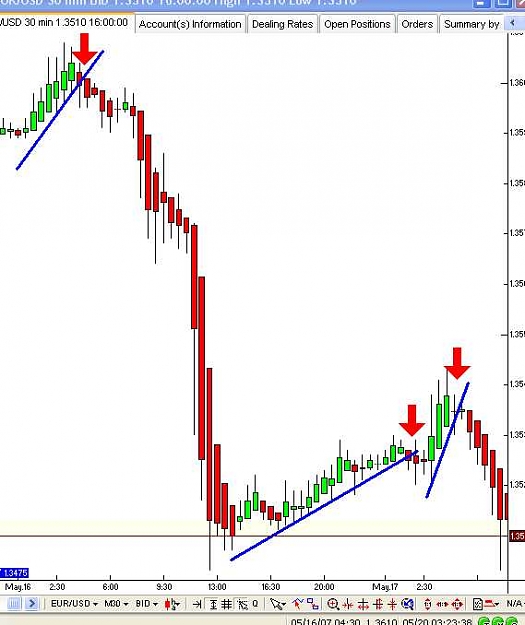
I love topics about support/resisitance. I have found that S/R works much better with heikin-ashi charts over regular candle charts. Everytime I go to enter a trade, I can not get way from these charts! They are very good at showing trends and by ...
S & R Cracked
- PipRippy replied Mar 19, 2007
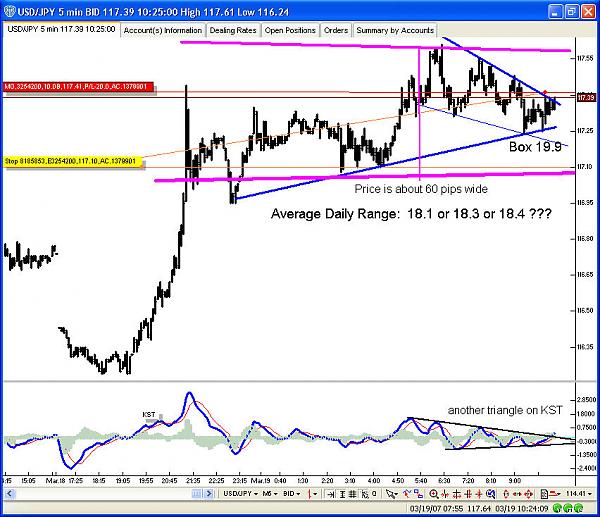
I am sorry, but I also have one more question if you do not mind. I am waiting for the triangle breakout on usd/jpy 4hr. Naturally I drop down to a shorter timeframe to see whats up with possible price direction. You can also notice that there is ...
Igrok Method. Q's & A's. Comments, thoughts and ideas
- PipRippy replied Mar 19, 2007
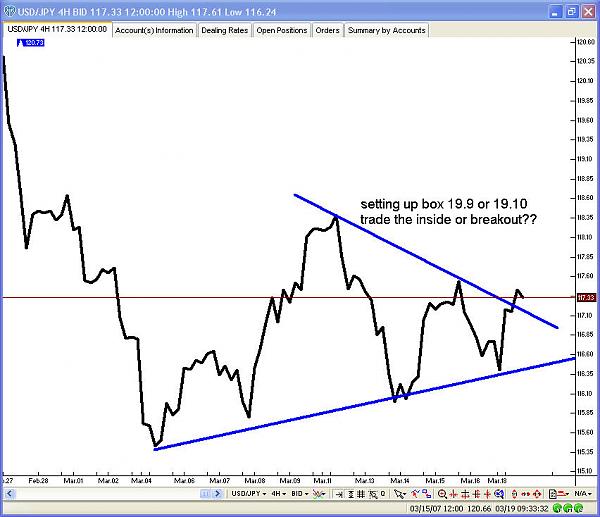
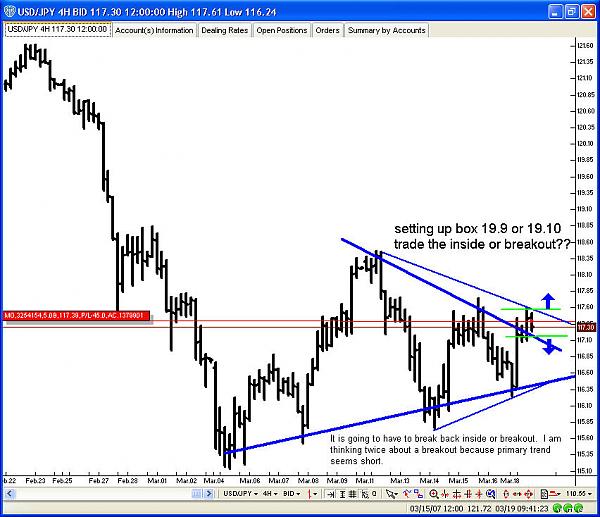
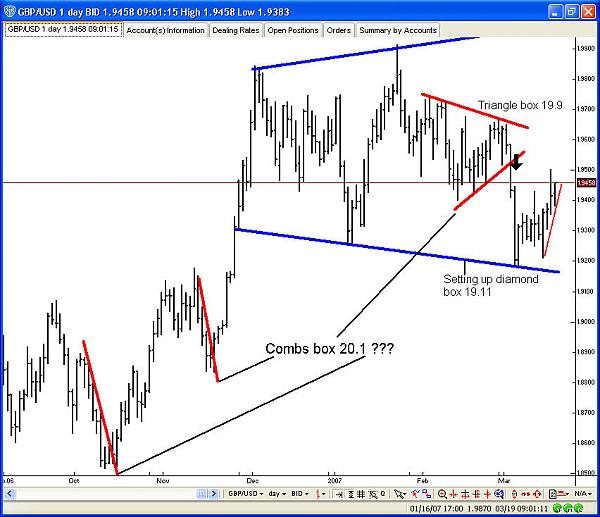
Here is a possible triangle trade I am setting up on 4hr Usd/Jpy. This would be a box 19.9 or 19.10. You can see the triangle first on 4hr line chart. image 1 Also, naturally a little bigger triangle with bar charts. image 2 My gut tells me to trade ...
Igrok Method. Q's & A's. Comments, thoughts and ideas
- PipRippy replied Mar 19, 2007
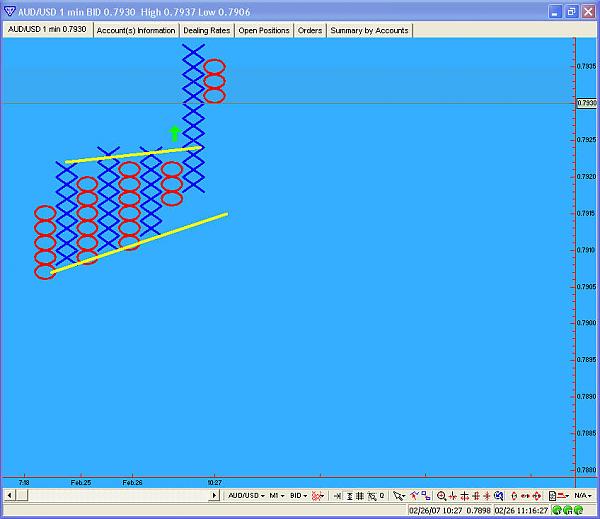
I have some questions regarding the comb formation on template 20.1 see image: Are the combs in red typical for the comb pattern (box 20.1) Would you have attempted the triangle box 19.9?? If I remember correctly- I did personally trade the ...
Igrok Method. Q's & A's. Comments, thoughts and ideas
- Chaikin's Volatility Indicator question?Started Mar 6, 2007|Trading Systems|10 replies
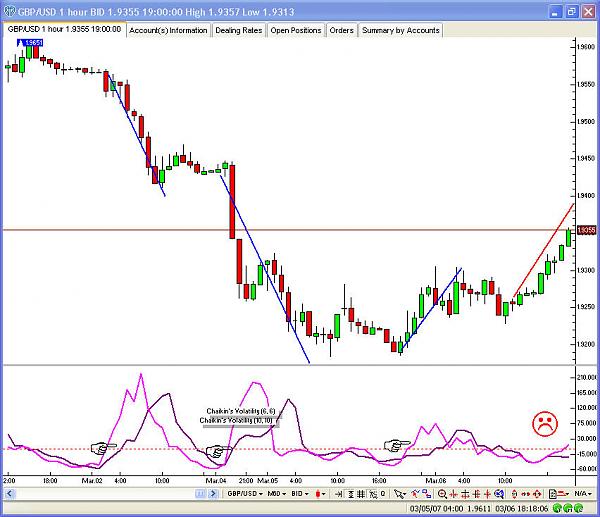
I have not found any signifigant methods or setups for the Chaikin Volatility indicator. You have ...
- Intraday Point and Figure TradingStarted Feb 26, 2007|Trading Discussion|545 replies
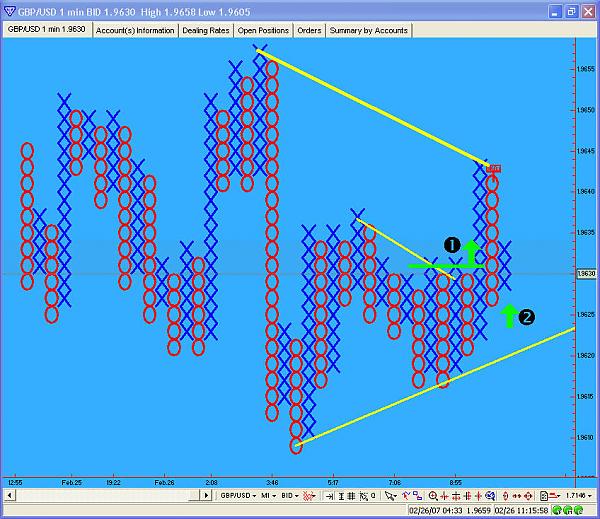
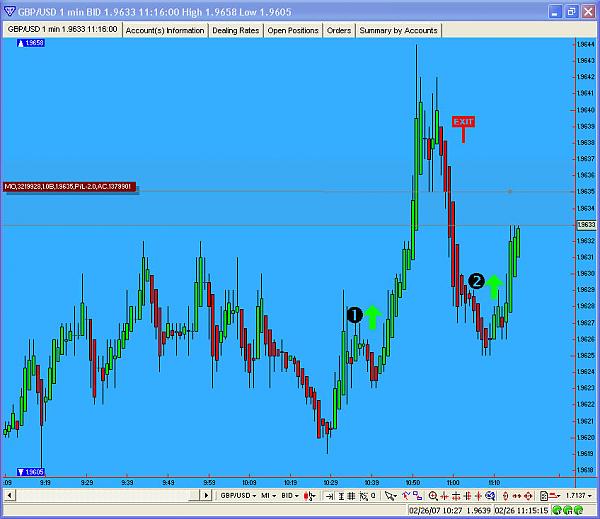
I read Micheal Archers's/James Bickford new book The Forex Chartist Companion:A Visual Approach to ...
- PipRippy replied Nov 28, 2006
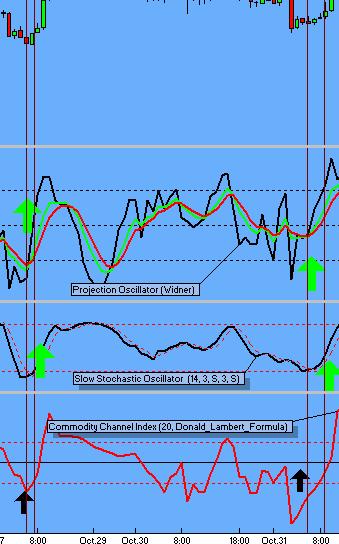
I have had very good results with the Price Projection Oscillator. It is very similar to the CCI- in that it seems to lead price and other oscillators. (see first pic) In the first image you can notice that the PPO will usually signal a crossover a ...
What is your favourite indicator and why ?

- PipRippy replied Nov 18, 2006
R-Squared Indicator request — I first came accross the r-square indicator in Martin Pring's, Momentum Explained II. IT is used as a confirmation indicator with trend indicators etc.. I have been using Pring's reccomened price projection ...
VTTrader: Request Indicator or Trading System for VT Trader

- PipRippy replied Jul 7, 2006
Variable timeframe timeframe — While using Bemac's variable ma timeframe indicator I found myself at first using the longer timeframes, Ex-(1hr chart use 4hr ma's). In my trading I always find myself quickly glancing down at a 5 min chart ...
VTTrader: Indicator Discussions for VT Trader
- PipRippy replied Jun 26, 2006
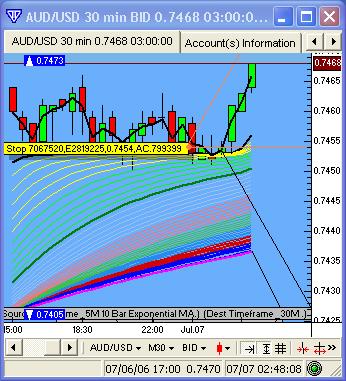
Bemac- Here is an example of a trade using the Overlayed Stoichastics and Fantail(see image). I started focusing on the EUR/USD because the longterm fantail was sweet. I dropped down to 5 min for a shorterm trade. I am still working out on the ...
VTTrader: Indicator Discussions for VT Trader

- PipRippy replied Jun 23, 2006
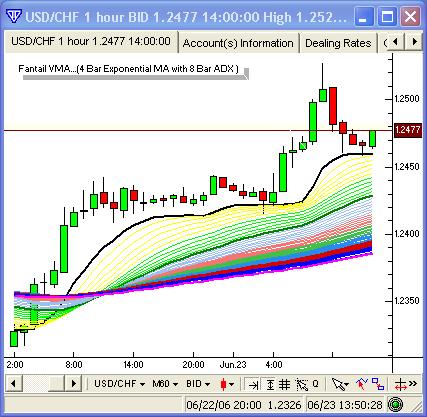
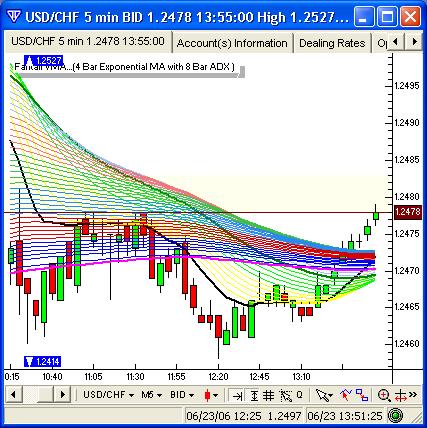
The setups I have been looking for with the fantail have been with a 1hr fantail and 5min fantail. These are some high probability shorterm trades in obvious trending markets. The 1hr fantail, or any timeframe, does a very good job of displaying a ...
VTTrader: Indicator Discussions for VT Trader
- PipRippy replied Jun 22, 2006
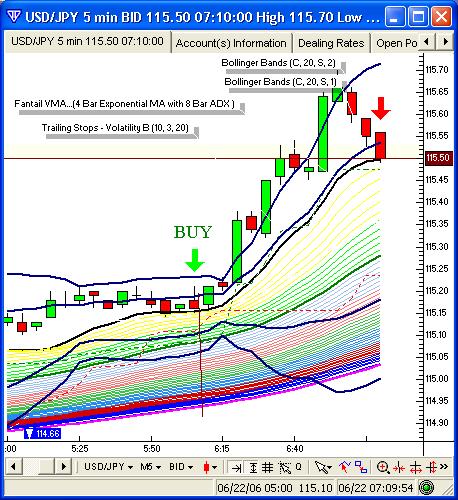
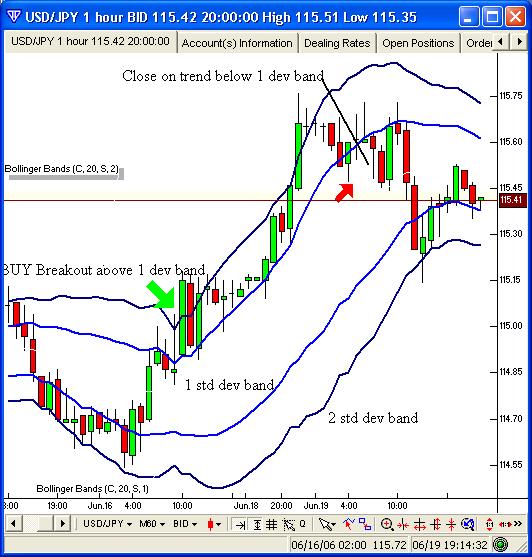
Here is a image of that same profitable fantail trade- this shows me using the Bollinger Band Bands as a trailing stop. I closed the trade when the red candle closed below the 1 dev Band (red arrow) IT also appears that you can use the shortest ...
VTTrader: Indicator Discussions for VT Trader
- PipRippy replied Jun 22, 2006
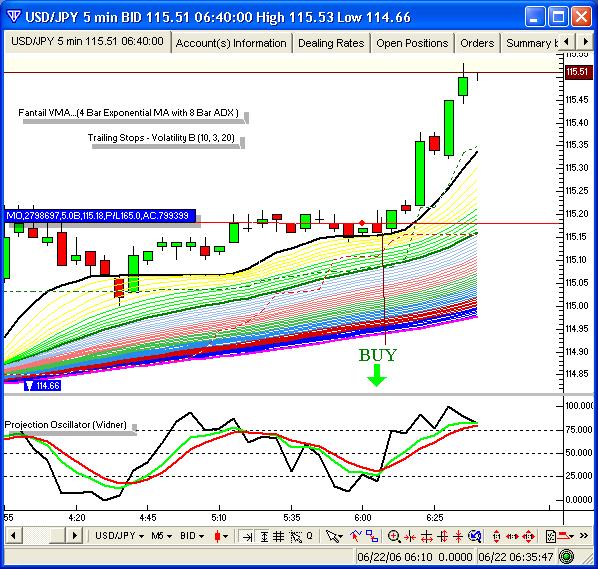
Bemac- I wake up this morning and decide to demo some fantail trades at start of euro morning 5am eastern(live in Texas). All of the majors are showing strong trending fantail formations on lower timeframes(5min-10min). Like you said wait until you ...
VTTrader: Indicator Discussions for VT Trader
- PipRippy replied Jun 19, 2006
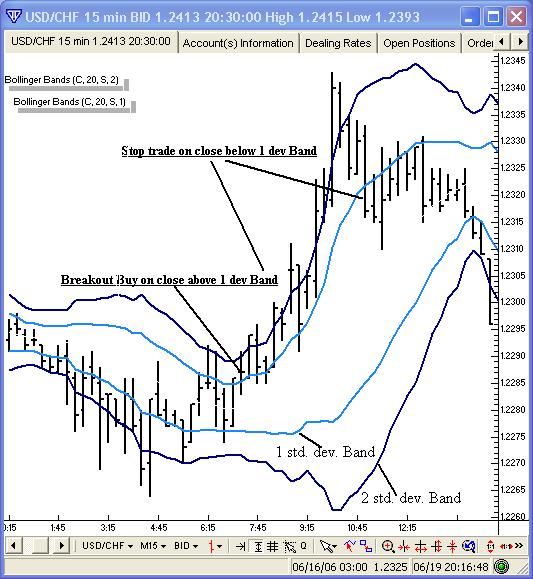
Here is a image of a proposed long Euro trade. Buy after the close above 1 dev band and stay with trade until close below 1 dev band. After that close you could target the lower 1 dev band- using the upper 1 dev band as a stoploss.
VTTrader: Request Indicator or Trading System for VT Trader
- PipRippy replied Jun 19, 2006
Bollinger Bands Bands Request — I am hoping that a programmer will take a intrest in some of Boris Schlossberg new book- Technical Analysis of the Currency Market. He uses a setup he calls "bollinger bands bands", it is simply a 2 standard dev ...
VTTrader: Request Indicator or Trading System for VT Trader
- Posts by Member Search: 'PipRippy'