- Search Forex Factory
- 157 Results (1 Thread , 156 Replies )
-
 NuckingFuts replied Mar 19, 2009
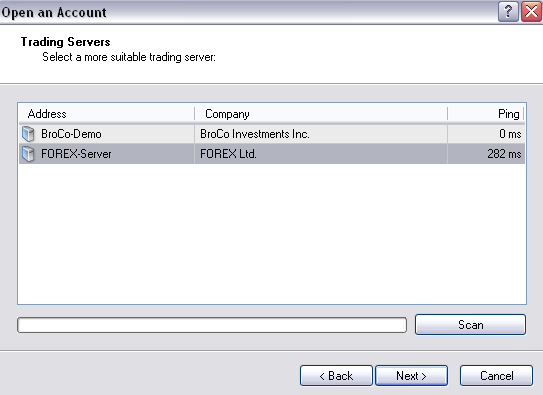
If you can't see it, it may the wrong feed. Make sure you use the IP address I gave in the other post. And also select the correct feed when registering a new account. It should say FOREX Ltd or it may have the IP address listed "65.175.79.18:443". ...
EURUSD
- NuckingFuts replied Mar 19, 2009
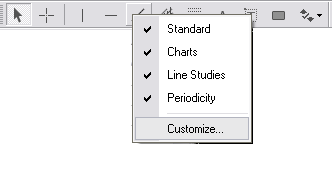
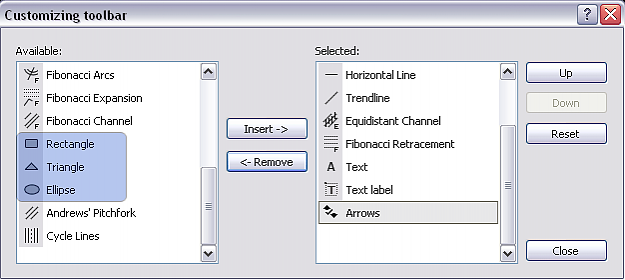
I use the rectangles in the toolbar where the trend lines/text label buttons are. If you can't see it, right click on your trendline button and select customize. You should then see a heap of things in the left hand side menu. In there you'll find ...
EURUSD
- NuckingFuts replied Mar 19, 2009
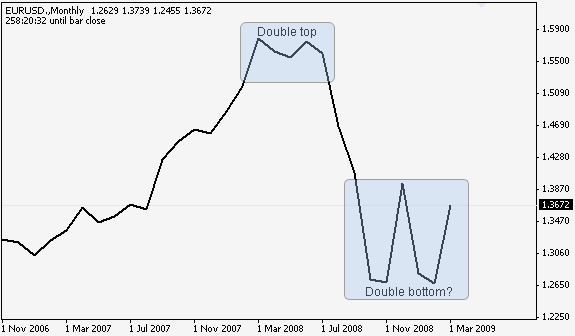
Starting to paint a pretty little picture on the monthly line chart.
EURUSD
- NuckingFuts replied Mar 19, 2009
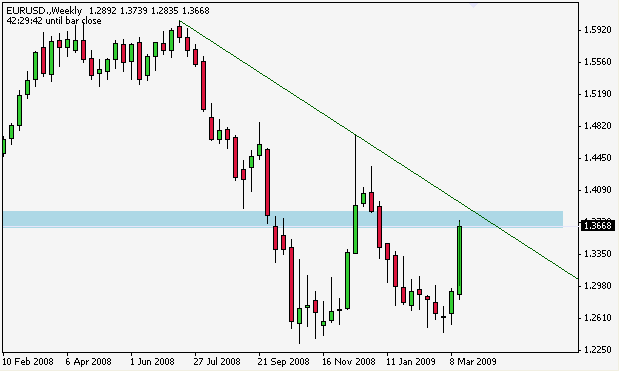
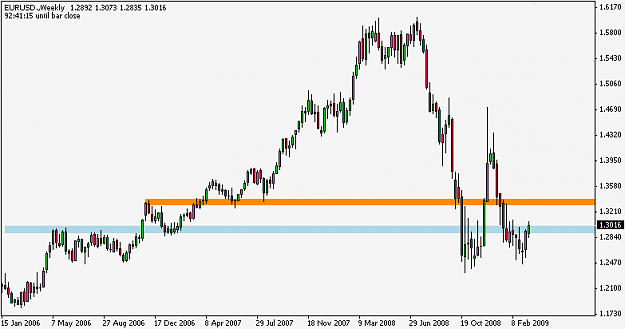
If we can bust through this PPZ, next stop should be the resistance TL around 1.39 - 1.40.
EURUSD
- NuckingFuts replied Mar 18, 2009
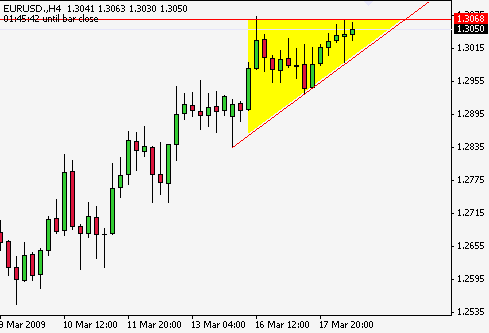
1.29-1.30 is proving to be a strong PPZ area. Price is having difficulties breaking below. We have what seems to be an ascending triangle on the 4hr. Not one of my favourite patterns, but it does suggest bulls are still in control.
EURUSD
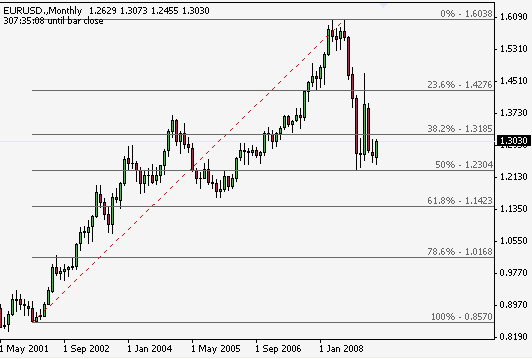
- NuckingFuts replied Mar 17, 2009
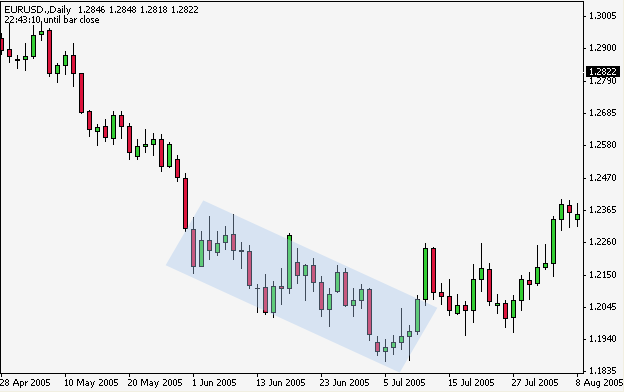
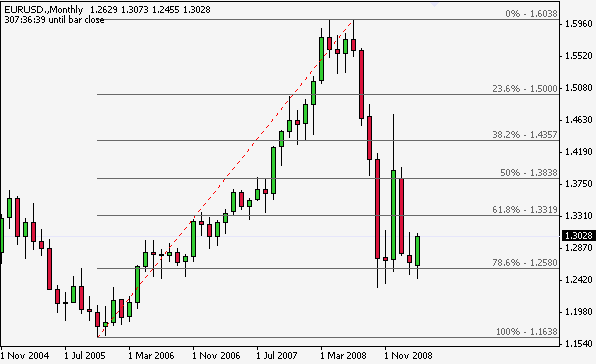
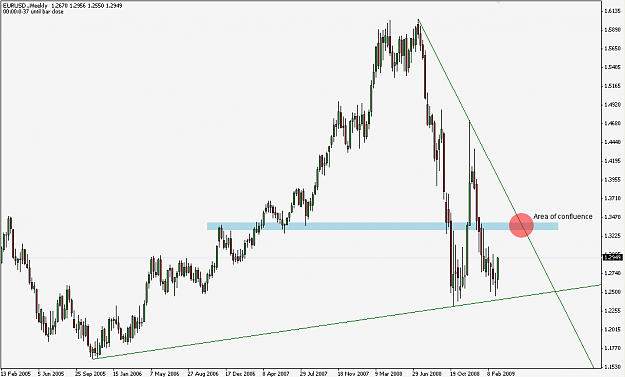
I'm not sure what's going on with your fibs there. Here's how I would have drawn them. Notice we have a 78.6% retrace of the 05-08 move and a 50% retrace of the 02-08 move. The secular trend is still up.
EURUSD
- NuckingFuts replied Mar 17, 2009
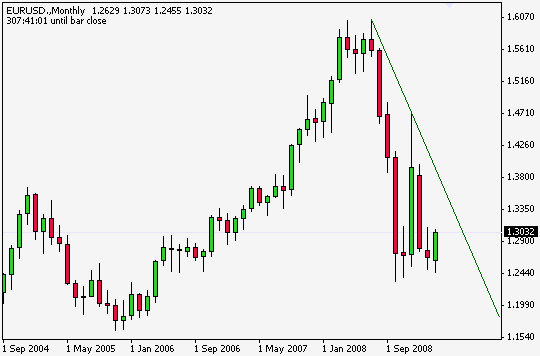
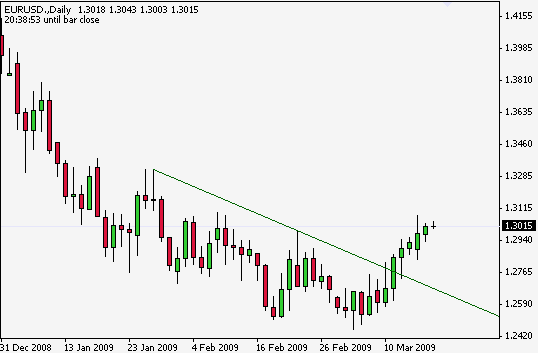
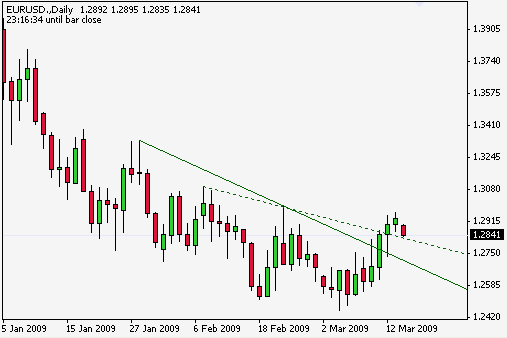
Possible yes. I'm thinking more of a descending triangle. I wouldn't be drawing TL's to highs that have not yet swung (i.e. still in progress)
EURUSD
- NuckingFuts replied Mar 17, 2009
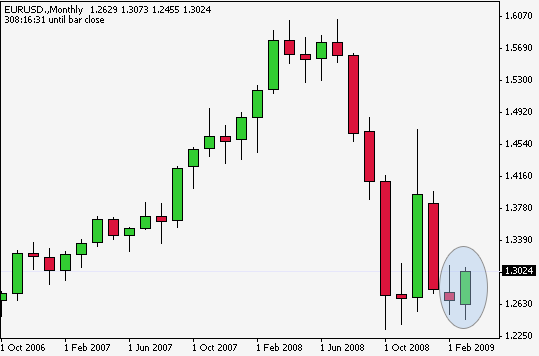
For those of you that follow candlestick patterns, it's looking like we could well have a confirmed inverted hammer and bullish engulfing candle if this monthly bar closes above 1.2675. It would be a little more picture perfect if the inverted ...
EURUSD
- NuckingFuts replied Mar 17, 2009
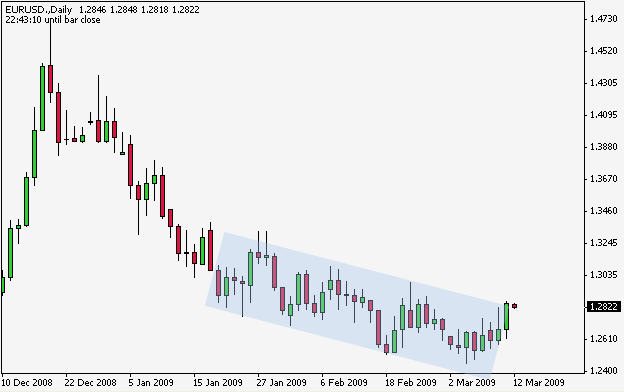
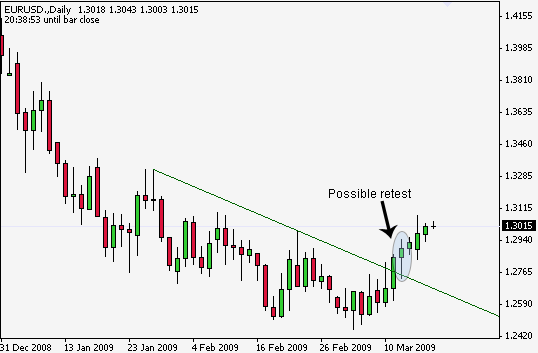
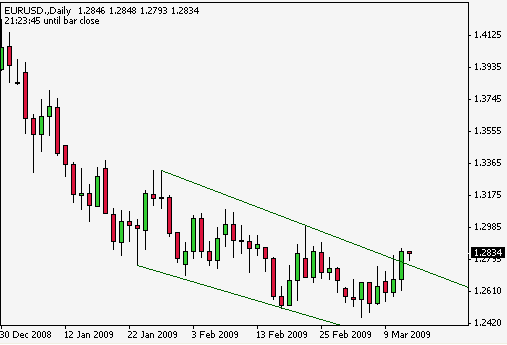
Looks like price is having trouble getting back down below the blue PPZ area. It is fails to do so, we should see it drift up towards the orange PPZ area. I would like to see a retest of the daily falling channel at some stage.
EURUSD
- NuckingFuts replied Mar 16, 2009
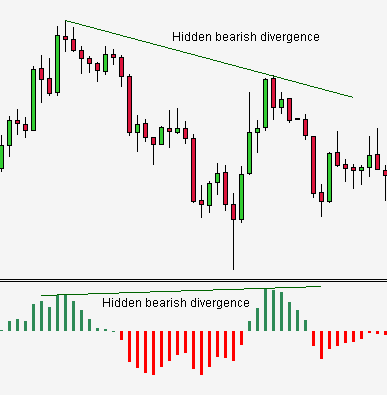
I can't see hidden divergence there. Hidden bearish divergence must have a lower high in price and a higher high in the oscillator.
Extracted Thread (per thread starter's request)
- NuckingFuts replied Mar 15, 2009
Yes, 1.30 PPZ and if broken, the next target will be the 1.33 PPZ area. We have some nice confluence at 1.33-34 with the weekly resistance trend line.
EURUSD
- NuckingFuts replied Mar 15, 2009
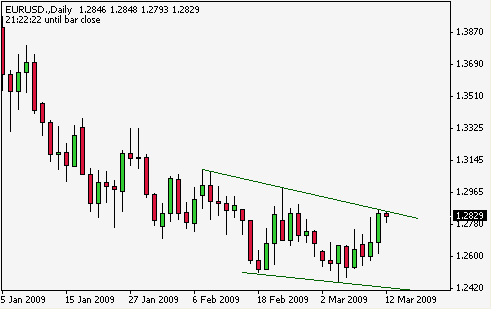
Falling weekly wedge/daily channel has been convincingly broken to the upside as expected. Still holding longs from 2500, 2550 and 2600. We have a gap down so we should see it close out before the weeks end. Two levels I will be watching for PA to ...
EURUSD
- NuckingFuts replied Mar 12, 2009
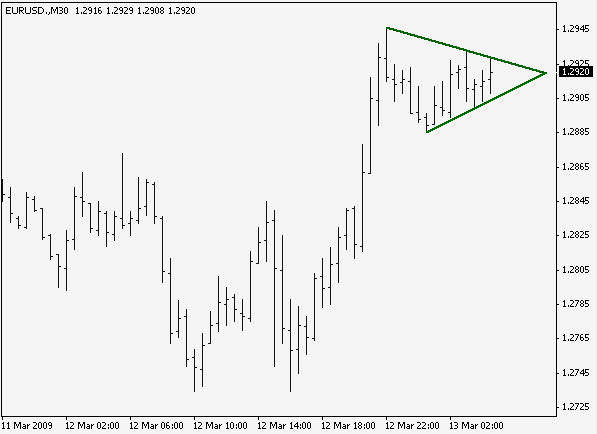
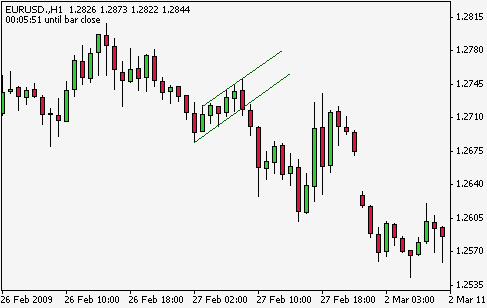
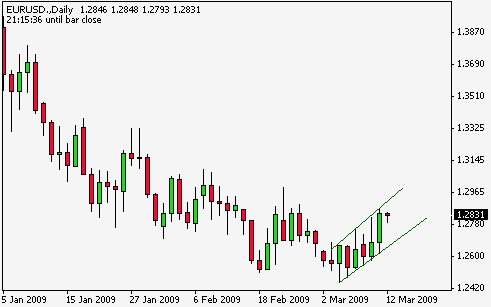
Bullish pennant on the 30m (with a pole
EURUSD ). I do however prefer flags to have channels instead of triangles. Much more reliable.
- NuckingFuts replied Mar 12, 2009
Sorry, I think I just got what your question was after
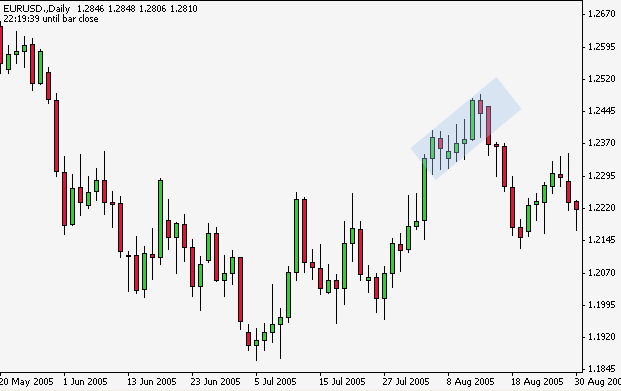
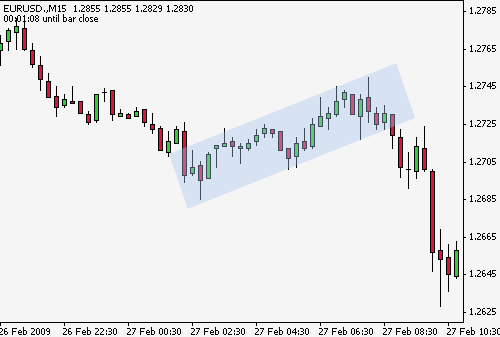
EURUSD It's the quality of the formation I am most concerned with. How do I explain... A narrow, clean trading range/channel is what I look for. Zoom out a timeframe or two and the good ones ...
- NuckingFuts replied Mar 11, 2009
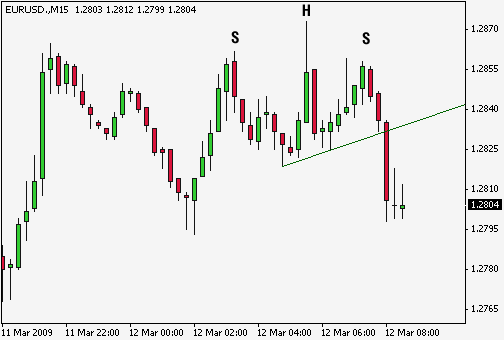
We have a minor break from the recent trading range. However, when I redraw my TL's to the most recent swings, we can see price is sitting right on resistance. I favour another move down given the bearish formation (the argued bear flag), but would ...
EURUSD
- NuckingFuts replied Mar 11, 2009
IMO the pole has little meaning to the pattern except the measuring of projected targets. I take note of this, but do not rely on it. I use PA to determine my exits as it is much more reliable. It's the formation of the flag/pennant without the pole ...
EURUSD