Follow price direction
-
No taper tantrum this time?
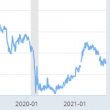
The FRED graph above shows the daily yield on 10-year U.S. Treasuries since the beginning of 2013. On May 22, 2013, Federal Reserve Chair Ben Bernanke announced that the Fed would start tapering asset purchases at some future date, which sent a negative shock to the market, causing bond investors to start selling their bonds. (See the dotted vertical line in the graph.) As a result, the yield on 10-year U.S. Treasuries rose from around 2% in May 2013 to around 3% in December. This sharp climb in yields is often referred to as the “taper tantrum.” In late July 2021, Federal Reserve officials signaled that the Fed ... (full story)
- Comments
- Subscribe
- Comment #1
- Quote
- Aug 30, 2021 11:54am Aug 30, 2021 11:54am
-
 hesron
 - Joined Dec 2012 | Status: Member | 1939 Comments
- Comment #2
- Quote
- Aug 30, 2021 1:10pm Aug 30, 2021 1:10pm
- DayTrader30
- | Joined Apr 2011 | Status: Member | 221 Comments
- Comment #3
- Quote
- Aug 30, 2021 1:45pm Aug 30, 2021 1:45pm
-
 nvcK
nvcK - | Joined Jan 2009 | Status: nvc...k? | 10 Comments
- Comment #4
- Quote
- Aug 30, 2021 2:06pm Aug 30, 2021 2:06pm
- Banditten
- Joined Sep 2019 | Status: Member | 1484 Comments
- Story Stats
- Posted: Aug 30, 2021 11:40am
- Submitted by:Category: Fundamental AnalysisComments: 4 / Views: 1,607