Forecasting gold prices is not easy, but right now it seems that we have quite many factors aligned.
Updated on Mar. 5, 2024
The market buys on rumors and sells on facts – even if they are positive. But if the facts are negative…
Then the market sells substantially, and the price declines significantly.
The recent rally can most likely be attributed to the rumor that the Fed might be engaging in 'Operation Reverse-Twist' which would lower short-term yields and steepen the yield curve. In other words, it seems that the markets thought that another QE is just ahead and since markets are forward-looking, they are adjusting to this rumor.
As I explained yesterday, in reality, another QE here is very unlikely as inflation is above Fed’s target and the stock market continues to rally.
Market’s reaction was emotional and the momentum that it generated didn’t burn itself out in just one day. It didn’t burn itself out on the second day either. It might have done so, if it wasn’t for the fact that Powell is going to testify before Congress on Wednesday and Thursday. This is when Powell would likely clarify the misunderstanding regarding Fed’s approach. And as he likely further emphasizes that it’s not time to cut rates just yet (and making also other not-dovish remarks), the hopes for QE here would likely decline – and so would the prices.
For now, the market continues to exaggerate its reaction, but it hasn’t invalidated its past patterns.
Quoting my yesterday’s analysis:
Let’s start with a very big perspective – what usually happens in March?
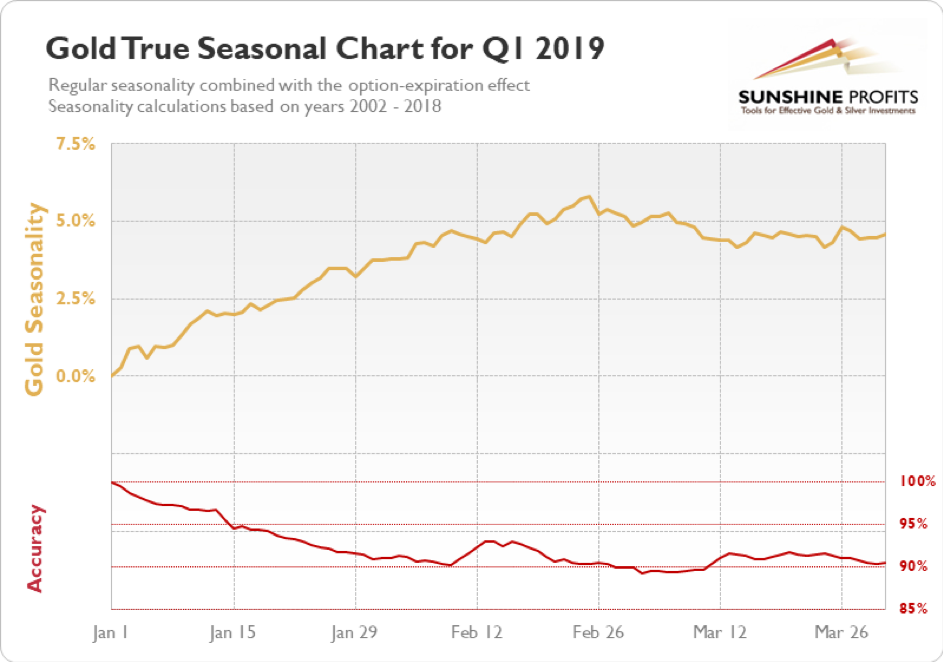
Based on the 2002-2018 data, gold price tends to top in late-Feb or early March. Here’s what happened in the following years:

Again, gold either declined in early March or it first rallied and then declined.
There was a notable exception in 2023, but at that time gold was after a clear decline – this was not the case recently.
So, first of all, this is not a good time for gold to soar and then hold those gain. Instead, it looks like a good time for gold to top.
Let’s keep in mind the fundamental/emotional background that I discussed earlier – since the rally “didn’t have legs” and was most likely just emotional, it’s unlikely to break the regular top-in-early-March pattern.
Second, some might say that since gold rallied on strong volume then it heralds even higher prices. Let’s check. Please focus on the vertical, blue, dashed lines – they mark cases when gold rallied on strong volume after periods of movement on average volume. In most cases, those moments were close to local tops.
Finally, it’s not just the time and volume that suggest a turnaround here – price at which gold currently is, also indicates the same thing.
Gold price just moved slightly above its 2020 top. This top served as resistance five times (or six, if you count the April 2022 attempt) – this is the sixth / seventh attempt to move above it.
Since the resistance here is very strong and it already proved to work, it’s likely that gold price will turn south from here.
Time, volume, price and my analysis of what happened and what didn’t happen – all suggest that this is a top in the making. What about the shape of gold’s recent movement?

Here’s what we see on the gold price chart now.
Gold formed a huge top in December 2023 and then it formed two distinct tops close to the 61.8% Fibonacci retracement level. Now it might be forming the third one.
The current rally took gold way above its initial highs, but it’s still below its initial December high.
Does it look familiar to you?
If you’re new to the gold market it might not, but if you’ve been following it for longer, it should. Let me refresh your memory.

A distinct top, and then three tops close to the 61.8% Fibonacci retracement based on the initial decline.
Yes, this time gold moved well above its 61.8% Fibonacci retracement, but the second top was below that level, and it’s also true that history rhymes – it doesn’t repeat itself to the letter. Overall, both patterns are still similar, just not extremely so.
That was what preceded one of gold’s biggest declines – the slice from about $1,800 below $1,200.
And yes, silver and mining stocks were underperforming gold at that time, just like they are underperforming it right now.
Time, volume, price, my analysis of what happened and what didn’t happen, gold’s price patterns, and the relative performance of silver and mining stocks – all point to lower, not higher, gold prices in the following weeks.
Is this REALLY such a great buying opportunity?
Also, whenever gold attempted to soar above its 2020 high it then reversed and started to decline within one day.
This time, given that investors might be waiting for Powell’s testimony, hoping for dovish confirmations, the “rumor stage” got extended.
But overall, the previous points remain intact – the history rhymes, it doesn’t have to repeat to the letter. The implications are still bearish, even though the next several hours are unclear.
The situation in the GDXJ confirms this.

The recent rally is normal given the previous assumptions about the market and does not invalidate them.
I mean the scenario in which miners form a short-term bottom below the recent lows. The recent rally seems significant on a day-to-day basis, but looking at it from the medium-term point of view reveals that it’s nothing to write home about.
It’s common for the GDXJ to move up by about $3 only to then slide to the final short-term low.
I marked the previous analogous cases with short, dashed blue lines and I also pointed to them right on the chart.
In early 2021, mid-2021, mid-2022, and in mid-2023 we saw the same thing. Junior miners soared back up in a fake rally that took the price back to its 50-day moving average (marked with blue). And then the final decline materialized.
Where did the recent rally take the GDXJ?
Slightly above its 50-day moving average.
So, not only is it the case that the medium-term downtrend clearly remains intact and not only do our short positions in the GDXJ remain profitable, but it is also the case that we just saw what usually happens right before the final short-term downswing. Even another small move up (perhaps to $35 or so) would be unlikely to change the outlook.
While the situation in gold is unclear for the next 1-2 days, it’s likely that it will turn south sooner than later and that mining stocks will decline once again as well. At least that’s what chart analysis implies, and it’s generally profitable to follow cold analysis rather than emotional momentum regardless of how tempting and irresistible it might seem when the “hot price move” is taking place.
Of course, the situation can change on any given day (or hour) and in this case I will keep my subscribers informed.
Thank you for reading today’s gold price forecast. In my premium Gold Trading Alerts, we're on a record of twelve profitable trades in junior miners (long and short) in a row and this trade is likely to be closed profitably as well. I encourage you to join my subscribers and get more details today, especially that for new subscribers, the first week is free.
And if you haven't signed up for our free gold newsletter, I strongly encourage you to catch up on that now and stay up-to-date with our exclusives.
Przemyslaw K. Radomski, CFA
Founder, Editor-in-chief