
Advertisement
Advertisement
USD/JPY Forecast: Tokyo Inflation Rates Raise Bets on a Bank of Japan Pivot
By:
Key Points:
- The USD/JPY rose by 0.31% on Monday, ending the session at 150.524.
- Inflation numbers from Japan drew investor interest early in the Tuesday session, fueling bets on an April Bank of Japan pivot from negative rates.
- Service sector PMIs from Japan and Bank of Japan chatter also need consideration before the US session.

In this article:
USD/JPY Movement on Monday
The USD/JPY rose by 0.31% on Monday. Following a 0.06% gain on Friday, the USD/JPY ended the Friday session at 150.524. The USD/JPY fell to a low of 149.837 before rising to a Monday session high of 150.567.
Tokyo Inflation Fuels Bets on an April Bank of Japan Pivot
On Tuesday, inflation figures for Tokyo garnered investor interest early in the session. The core annual inflation rate accelerated from 1.6% to 2.5% in February. The annual inflation rate picked up from 1.6% to 2.6%. Economists forecast rates of 2.5% and 2.1%, respectively. The move through the 2.0% target raised bets on an April Bank of Japan pivot from negative rates.
Later this morning, finalized Services PMI numbers also need consideration. The Bank of Japan recently signaled an increase in reliance on the services sector to fuel demand-driven inflationary pressure.
According to the preliminary survey, the Jibun Bank Services PMI fell from 53.1 to 52.5 in February. Beyond the headline numbers, investors must consider the prices and employment sub-components. Higher input prices from wages and employment would also support bets on an April pivot.
Beyond the numbers, investors must monitor Bank of Japan commentary. Reaction to the inflation numbers and views on the timeline to exit negative rates could move the dial.
US Economic Calendar: ISM Services PMI and the Fed
On Tuesday, the ISM Services PMI and sub-components will draw investor interest. The services sector accounts for over 70% of the US economy. An unexpected pickup in service sector activity could reduce bets on a June Fed rate cut.
Economists forecast the ISM Services PMI to fall from 53.4 to 53.0 in February.
Beyond the headline number, the Prices and Employment sub-components also need consideration. Economists predict the ISM Services Prices Index to fall from 64.0 to 63.0 and the Employment Index to slip from 50.5 to 50.4. Upward trends in the Prices and Employment Indexes could influence consumer price inflation trends and the Fed rate path.
With the US services sector in focus, investors must also consider Fed speeches. Views on inflation, the economy, and the timing of interest rate cuts would influence buyer demand for the US dollar. FOMC member Michael Barr is on the calendar to speak on Tuesday.
Short-term Forecast
Near-term trends for the USD/JPY will remain hinged on Shunto wage negotiations in March and the US Jobs Report. After the Tokyo inflation numbers, a marked increase in Japanese wages could allow the Bank of Japan to exit negative rates. A weaker-than-expected US Jobs Report could cement bets on a June Fed rate cut and tilt monetary policy divergence toward the Yen.
USD/JPY Price Action
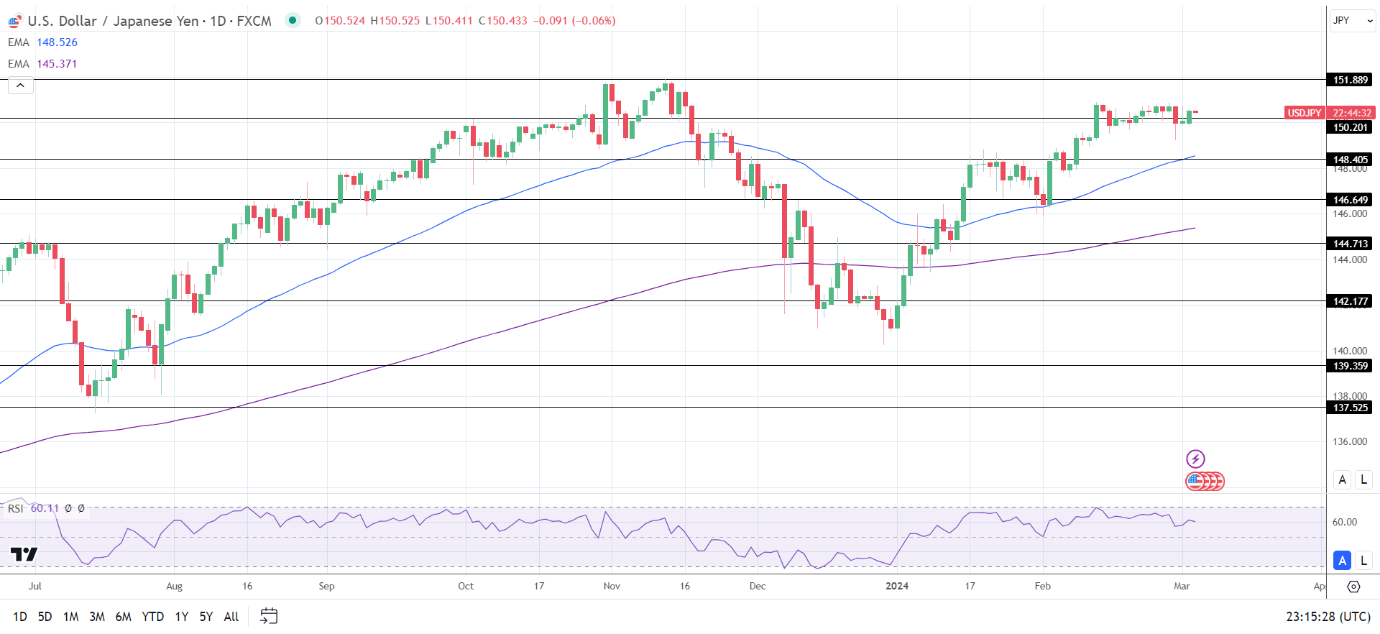
Daily Chart
The USD/JPY hovered above the 50-day and 200-day EMAs, affirming bullish price signals.
A USD/JPY breakout from the 150.500 handle would support a move toward the 151.889 resistance level.
Service sector PMIs and central bank chatter need consideration.
However, a break below the 150.201 support level would bring the 149.500 handle into play.
The 14-day RSI at 60.11 suggests a USD/JPY return to the 151 handle before entering overbought territory.
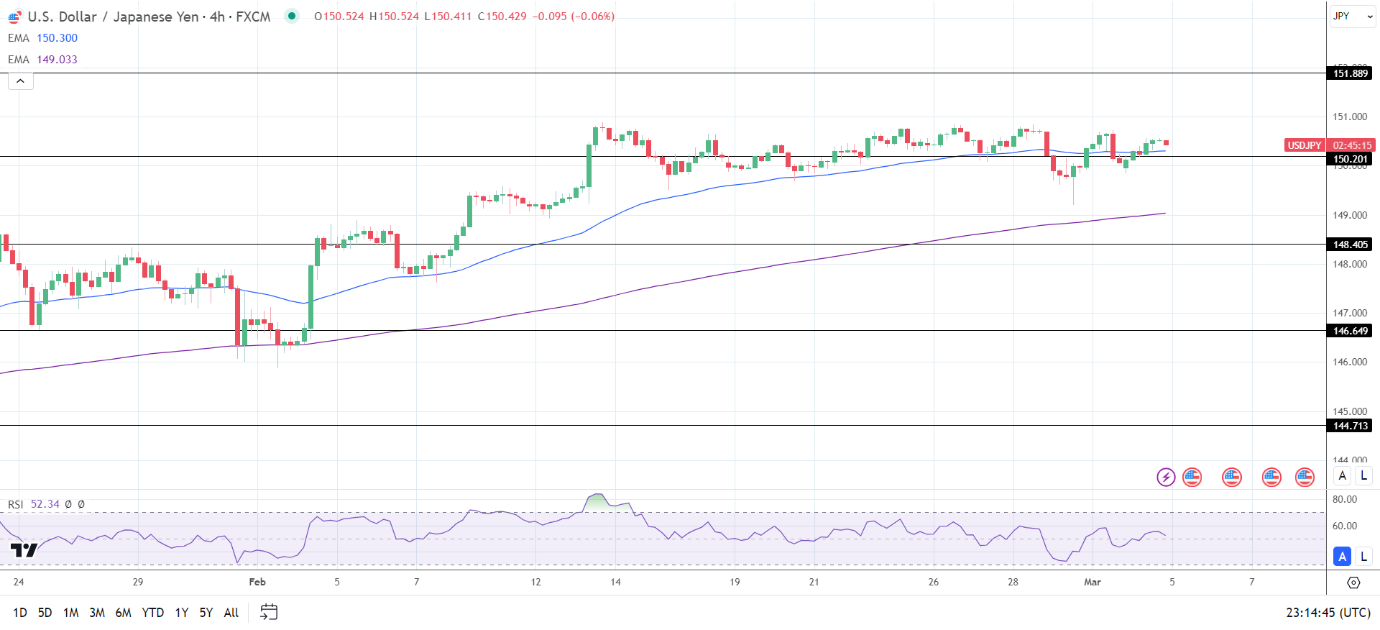
4-Hourly Chart
The USD/JPY sat above the 50-day and 200-day EMAs, affirming the bullish price signals.
A USD/JPY return to the 150.500 handle would give the bulls a run at the 151.889 resistance level.
However, a drop below the 50-day EMA and the 150.201 support level would bring the 149.500 handle into play.
The 14-period 4-hour RSI at 52.34 indicates a USD/JPY move to the 151.889 resistance level before entering overbought territory.
About the Author
Bob Masonauthor
With over 20 years of experience in the finance industry, Bob has been managing regional teams across Europe and Asia and focusing on analytics across both corporate and financial institutions. Currently he is covering developments relating to the financial markets, including currencies, commodities, alternative asset classes, and global equities.
Did you find this article useful?
Latest news and analysis


Advertisement