
Advertisement
Advertisement
USD/JPY Forecast: Retail Sales Support a BoJ Pivot Amid US Inflation Focus
By:
Key Points:
- The USD/JPY gained 0.12% on Wednesday, closing the session at 150.686.
- On Thursday, retail sales figures from Japan likely influenced bets on an April Bank of Japan pivot from negative rates.
- Later in the session, US inflation, personal income/spending, and Fed speakers warrant investor attention.

In this article:
USD/JPY Movement on Wednesday
The USD/JPY gained 0.12% on Wednesday. Reversing a 0.12% loss from Tuesday, the USD/JPY ended the Wednesday session at 150.686. The USD/JPY fell to a low of 150.369 before rising to a Wednesday high of 150.844.
Retail Sales and the Bank of Japan in Focus
On Thursday, retail sales and industrial production figures drew investor interest. Retail sales increased by 0.8% in January after sliding by 2.9% in December. Retail sales were up 2.3% year-over-year in January compared with 2.4% in December. Economists forecast retail sales to increase by 0.6% month-on-month and by 2.3% year-over-year.
After the hotter-than-expected January inflation numbers, the pickup in retail sales may further fuel bets on an April Bank of Japan pivot from negative rates.
The Bank of Japan needs wage growth and household consumption to fuel demand-driven inflation. A pickup in demand-driven inflation would enable the BoJ to exit negative rates to deliver price stability. Following the retail sales and inflation numbers, the spring wage negotiations could decide the timeline for a BoJ move.
However, a slide in industrial production numbers could deliver some uncertainty about the timeline for a BoJ pivot. Industrial production tumbled by 7.5% in January after rising by 1.4% in December. Economists forecast a 7.3% decline. A deteriorating economic backdrop may impact household spending plans.
Later this morning, housing sector data will unlikely influence the buyer appetite for the USD/JPY. Bank of Japan plans to exit negative rates remain hinged on wage growth, household spending, and inflation.
Beyond the numbers, investors must consider BoJ reactions to the inflation and retail sales figures. Views on the timeline to exit negative rates would move the dial.
US Economic Calendar: US Inflation and the Fed
On Thursday, the US Personal Income and Outlays Report warrants investor attention. The Core PCE Price Index will likely be the focal point. Hotter-than-expected inflation numbers could impact bets on an H1 2024 Fed rate cut.
Economists forecast the Core PCE Price Index to increase by 2.8% year-over-year in January. In December, the Core PCE Price Index rose by 2.9% year-over-year.
While the inflation figures will likely be the focal point, personal income and spending figures also need consideration. Upward trends in income and spending could fuel demand-driven inflation and delay the timeline for a Fed rate cut.
A more hawkish Fed rate path may impact borrowing costs and reduce disposable income. Downward trends in disposable income could curb consumer spending and dampen demand-driven inflation.
Other stats include the Chicago PMI, weekly jobless claims, and pending home sales. However, the Personal Income and Outlays Report will impact the USD/JPY more.
With inflation in focus, FOMC member commentary needs monitoring. Fed Vice Chair John Williams and FOMC members Austan Goolsbee, Loretta Mester, and Raphael Bostic are on the calendar to speak. Reactions to the Personal Income and Outlays Report and views on Fed rate cuts would move the dial.
Short-term Forecast
Near-term trends for the USD/JPY will likely hinge on US inflation numbers and central bank chatter. Hotter-than-expected US inflation numbers could bring the 151 handle into play. However, the spring wage negotiations remain pivotal for a BoJ pivot from negative rates.
USD/JPY Price Action
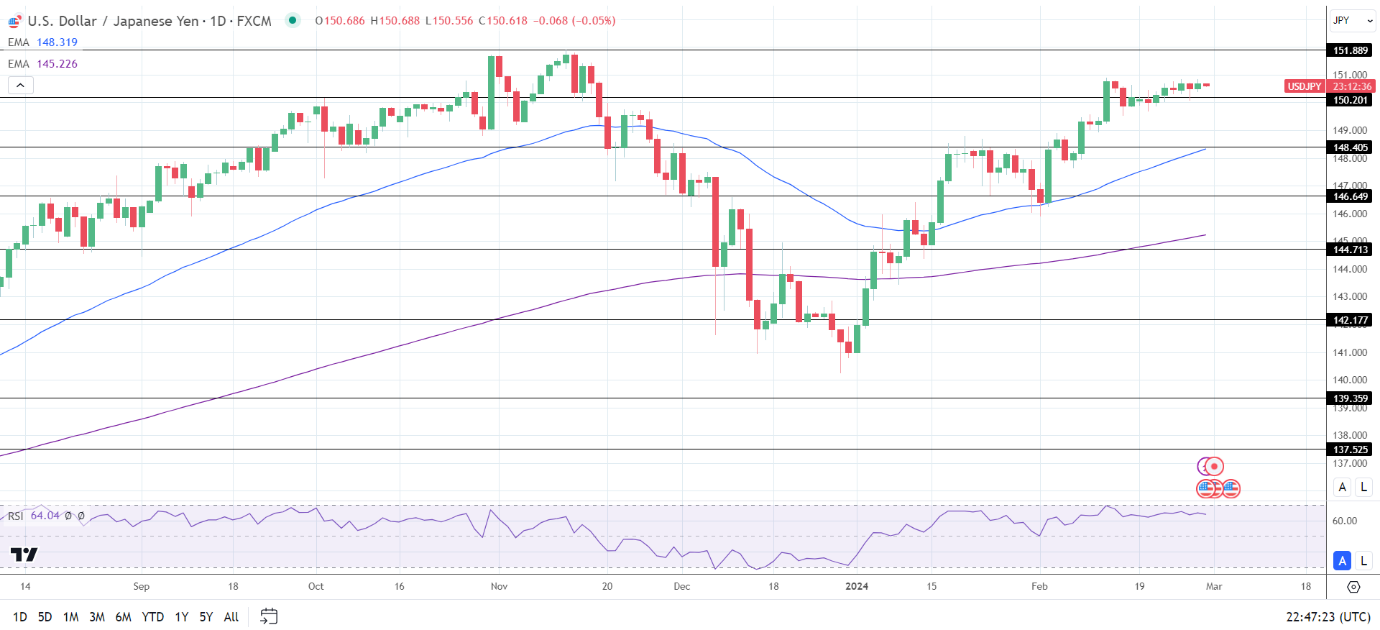
Daily Chart
The USD/JPY sat above the 50-day and 200-day EMAs, sending bullish price signals.
A USD/JPY move to the 150.500 handle would bring the 151.889 resistance level into play.
Central bank chatter and the US Personal Income and Outlays Report need consideration.
However, a drop below the 150.201 support level would give the bears a run at the 148.405 support level.
The 14-day RSI at 64.04 indicates a USD/JPY move to the 151.889 resistance level before entering overbought territory.
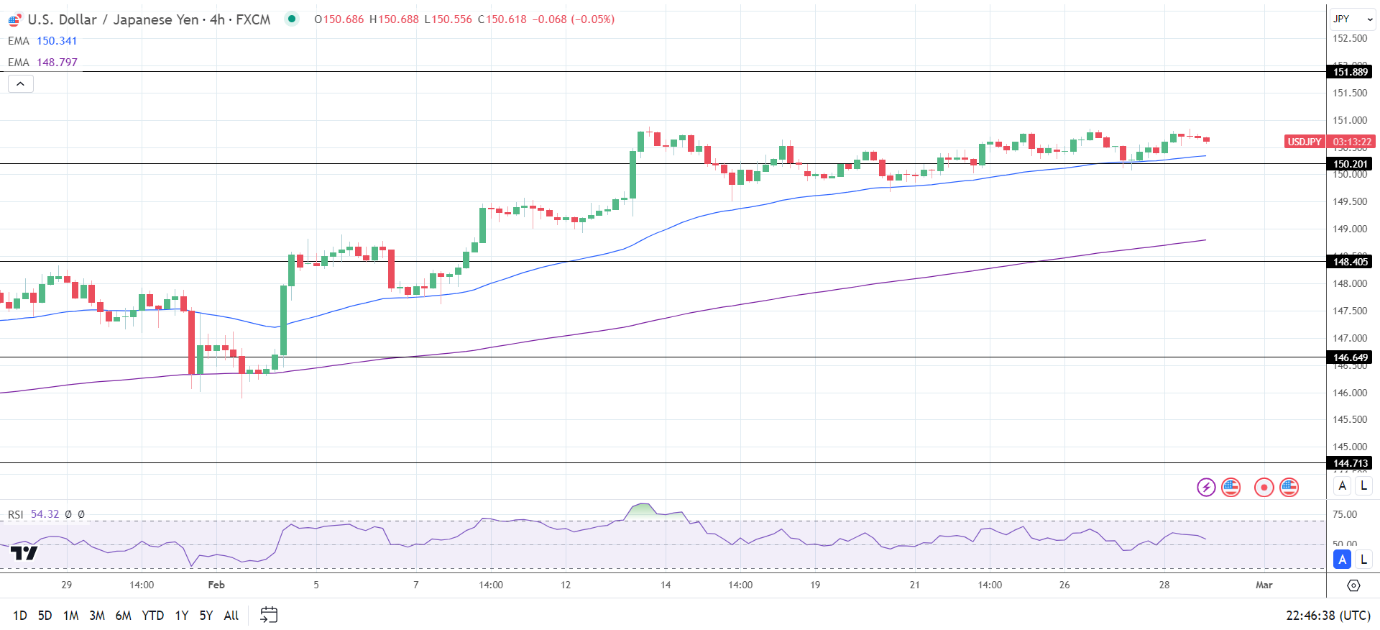
4-Hourly Chart
The USD/JPY remained above the 50-day and 200-day EMAs, confirming the bullish price trends.
A USD/JPY move to the 151 handle would give the bulls a run at the 151.889 resistance level.
However, a fall through the 50-day EMA and the 150.201 support level may bring the 149.500 handle into view.
The 14-period 4-hour RSI at 54.32 indicates a USD/JPY move to the 151.889 resistance level before entering overbought territory.
About the Author
Bob Masonauthor
With over 20 years of experience in the finance industry, Bob has been managing regional teams across Europe and Asia and focusing on analytics across both corporate and financial institutions. Currently he is covering developments relating to the financial markets, including currencies, commodities, alternative asset classes, and global equities.
Did you find this article useful?
Latest news and analysis


Advertisement