
Advertisement
Advertisement
USD/JPY to Engulf Resistance This Week?
By:
USD/JPY is seen threatening to overthrow resistances in the coming weeks!

In this article:
USD/JPY at Familiar Long-Term Resistance
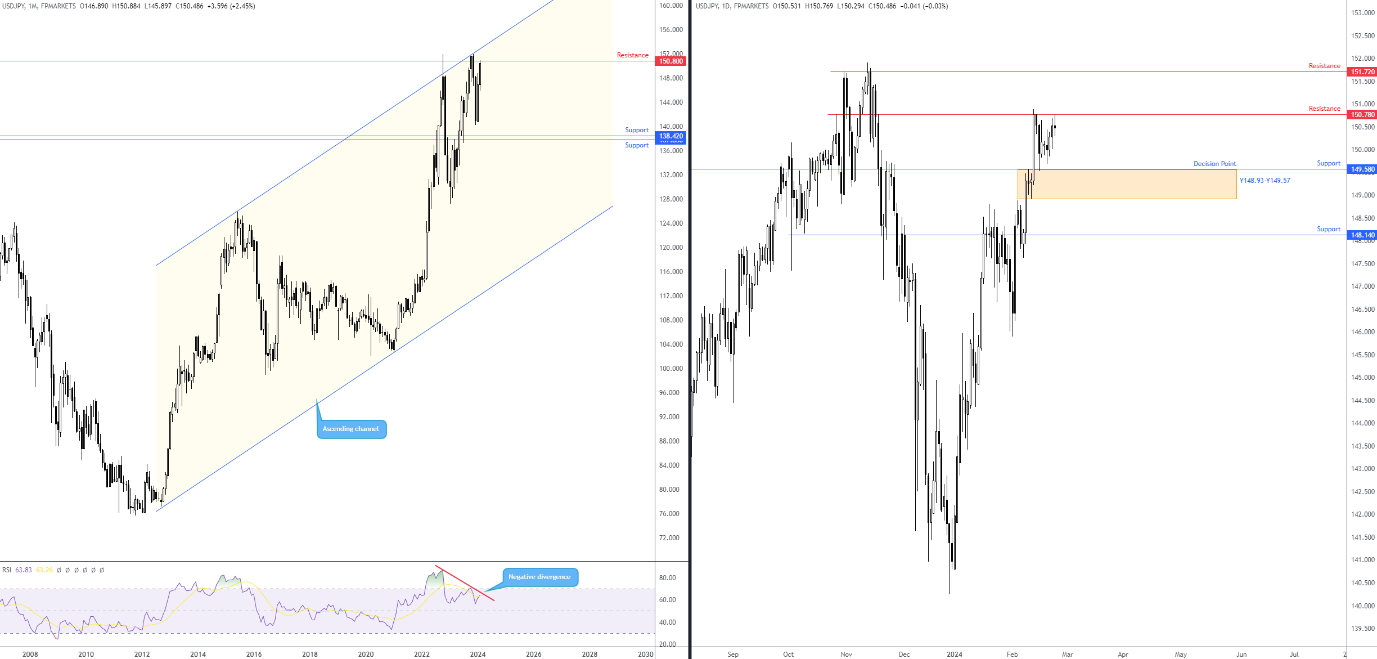
The US dollar (USD) ended a second week in positive terrain against the Japanese yen (JPY), leading the USD/JPY currency pair back to familiar resistance on the monthly chart at ¥150.80. However, things are not looking too bright for USD/JPY bears at this point. On the one hand, the trend is notably in favour of buyers, and has largely been the case since bottoming in early 2012.
On the other hand, the aforementioned monthly resistance—albeit welcoming a sizeable rejection in October 2022, and is a level sharing chart space with channel resistance, extended from the high of ¥125.85 (along with the Relative Strength Index [RSI] offering negative divergence)—failed to spark much of a reaction in late 2023. In fact, sellers left neighbouring support unchallenged at ¥138.42. From a technical standpoint, then, this echoes a market where buyers are in the driving seat and the currency pair could venture beyond the noted resistances.
Daily Chart Shows Buyers in Control
Across the page on the daily timeframe, it is all about the resistance level plotted at ¥150.78.
Following the breakout higher on 13 February, which left behind a decision point zone between ¥148.93 and ¥149.57, as well as a support level from ¥149.58, resistance entered the fold at ¥150.78. Although technically we have resistance in play on the monthly at ¥150.80 and the daily resistance located two pips south at ¥150.78, the lacklustre bearish response from daily resistance and failure to move beyond support at ¥149.58 communicates to the market that buyers may attempt to engulf current resistances in the coming weeks.
Consequently, a daily close north of ¥150.80 this week could welcome breakout buying, targeting daily resistance coming in from ¥151.72, followed by another possible test of the monthly channel resistance level fixed just north of the support.
DISCLAIMER:
The information contained in this material is intended for general advice only. It does not take into account your investment objectives, financial situation or particular needs. FP Markets has made every effort to ensure the accuracy of the information as at the date of publication. FP Markets does not give any warranty or representation as to the material. Examples included in this material are for illustrative purposes only. To the extent permitted by law, FP Markets and its employees shall not be liable for any loss or damage arising in any way (including by way of negligence) from or in connection with any information provided in or omitted from this material. Features of the FP Markets products including applicable fees and charges are outlined in the Product Disclosure Statements available from FP Markets website, www.fpmarkets.com and should be considered before deciding to deal in those products. Derivatives can be risky; losses can exceed your initial payment. FP Markets recommends that you seek independent advice. First Prudential Markets Pty Ltd trading as FP Markets ABN 16 112 600 281, Australian Financial Services License Number 286354.
About the Author
Aaron Hillcontributor
Aaron graduated from the Open University and pursued a career in teaching, though soon discovered a passion for trading, personal finance and writing.
Did you find this article useful?
Latest news and analysis


Advertisement