
Advertisement
Advertisement
USD/JPY Forecast: Economic Data and Intervention Risks Impact Price Action
By:
Friday's focus: US producer prices, consumer sentiment, and Fed commentary, influence the USD/JPY's near-term trajectory amid intervention concerns.

In this article:
Highlights
- The USD/JPY fell by 0.42% on Thursday, ending the session at 149.891.
- Japanese government threats of intervention and weaker-than-expected US retail sales figures contributed to the losses.
- The Bank of Japan, US economic data, and Fed commentary need consideration on Friday.
USD/JPY Movement on Thursday
The USD/JPY declined by 0.42% on Thursday. Following a 0.16% loss on Wednesday, the USD/JPY ended the day at 149.891. The USD/JPY rose to a high of 150.567 before falling to a low of 149.509.
Interventions and Recessions
On Thursday, the USD/JPY ended the session in negative territory despite Japan falling into a technical recession.
The renewed threat of a Japanese government intervention to bolster the Yen limited the USD/JPY reaction to the Q4 GDP numbers. In Q4, the Japanese economy contracted by 0.1% quarter-on-quarter. An unexpected fall in private consumption contributed to the economic contraction.
Despite the Q4 GDP numbers, market bets on a Bank of Japan pivot from negative rates linger. However, the timeline may have shifted after the GDP numbers.
The focus remains on wage negotiations in March. Sizeable increases in wages could fuel private consumption and demand-driven inflation. However, the macroeconomic environment must improve for firms to justify increasing wages and for consumers to loosen their purse strings.
There are no economic indicators from Japan for investors to consider. However, Bank of Japan commentary needs consideration. Views on the economy, inflation, and interest rates would move the dial. Further threats of intervention would also impact the USD/JPY pairing.
US Economic Calendar: Producer Prices, Consumer Sentiment, and the Fed
On Friday, US producer prices and consumer sentiment warrant investor attention. A pickup in producer prices could signal an upward trend in consumer prices. Producers increase prices in a higher-demand environment and pass costs onto consumers.
Higher demand could fuel demand-driven inflation, forcing the Fed to delay cutting interest rates. A higher-for-longer Fed rate path could reduce disposable income and curb consumer spending.
Economists forecast producer prices to increase by 0.1% in January after falling by 0.1% in December.
Additionally, consumer confidence also influences consumer spending trends and demand-driven inflation. An upward trend in consumer confidence would signal a pickup in consumer spending.
Economists forecast the Michigan Consumer Sentiment Index to increase from 79 to 80 in February. Beyond the headline figure, consumer inflation expectations will also need consideration.
However, investors must monitor Fed speeches. FOMC member Michael Barr is on the calendar to speak. Reactions to retail sales, the US CPI Report, and views on Fed rate cuts would move the dial.
Short-term Forecast
Near-term trends for the USD/JPY hinge on the Bank of Japan, the US economic data, and Fed commentary. Bank of Japan pledges to exit negative rates could tilt monetary policy divergence toward the Yen. Intervention threats also need consideration and may cap the upside for the USD/JPY pairing.
USD/JPY Price Action
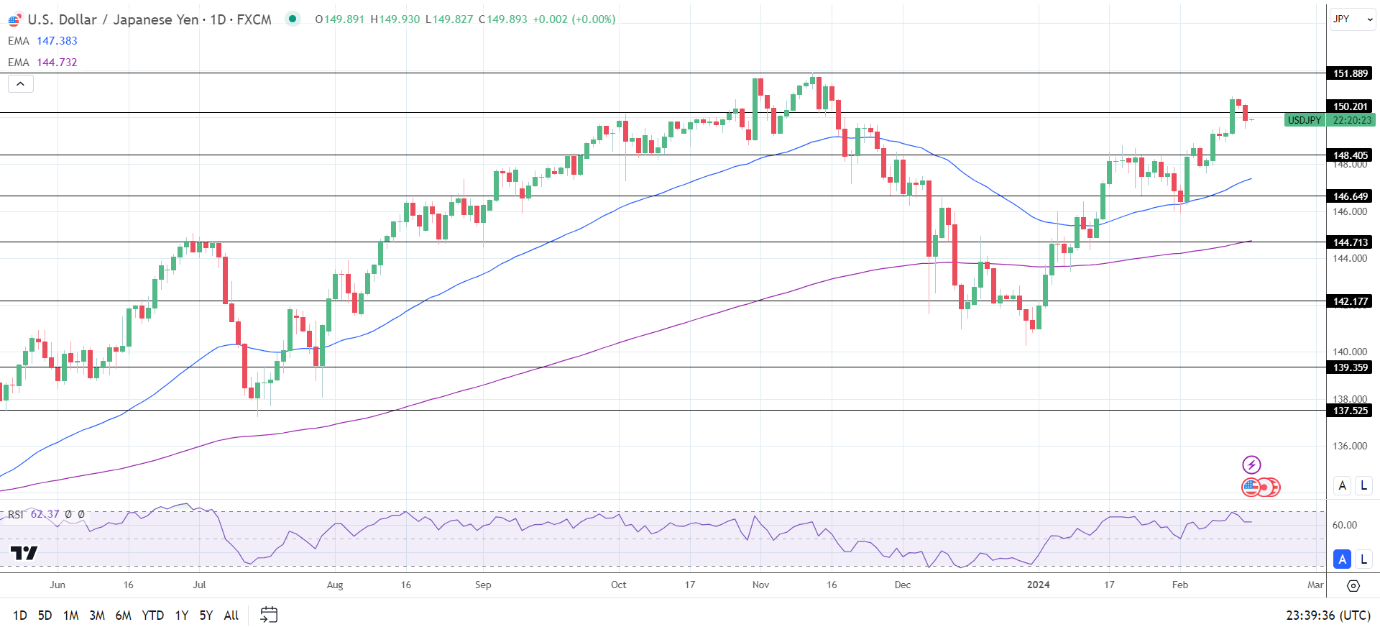
Daily Chart
The USD/JPY sat above the 50-day and 200-day EMAs, sending bullish price signals.
A USD/JPY break above the 150.201 resistance level would bring the 151.889 resistance level into play.
US economic data, central bank commentary, and Japanese Government intervention threats need consideration.
However, a drop below the 149 handle would support a fall toward the 148.405 support level.
The 14-day RSI at 62.37 indicates a USD/JPY return to the 151 handle before entering overbought territory.
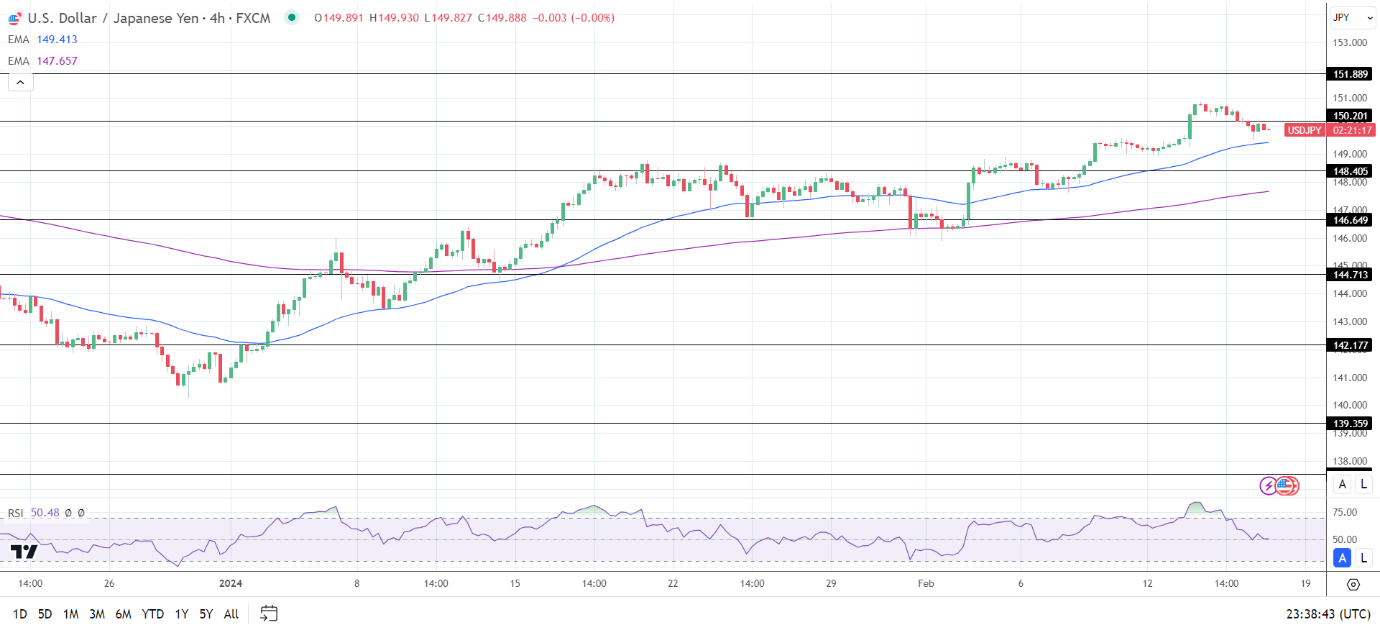
4-Hourly Chart
The USD/JPY remained above the 50-day and 200-day EMAs, confirming the bullish price trends.
A USD/JPY break above the 150.201 resistance level would support a move to the 151.889 resistance level.
However, a fall through the 50-day EMA would give the bears a run at the 148.405 support level.
The 14-period 4-hour RSI at 50.48 indicates a USD/JPY move to the 151 handle before entering overbought territory.
About the Author
Bob Masonauthor
With over 20 years of experience in the finance industry, Bob has been managing regional teams across Europe and Asia and focusing on analytics across both corporate and financial institutions. Currently he is covering developments relating to the financial markets, including currencies, commodities, alternative asset classes, and global equities.
Did you find this article useful?
Latest news and analysis


Advertisement