
Advertisement
Advertisement
USD/JPY Forecast: The Bank of Japan and US Economic Calendar in Focus
By:
Recent economic indicators from Japan supported bets on a Bank of Japan pivot from negative rates. However, US data will impact the USD/JPY on Thursday.

In this article:
Highlights
- The USD/JPY declined by 0.54% on Wednesday, ending the session at 147.487.
- Economic indicators from Japan supported bets on a Q2 Bank of Japan pivot from negative rates.
- On Thursday, BoJ commentary, US GDP, and US Jobless Claims warrant investor attention.
USD/JPY Movement on Wednesday
The USD/JPY declined by 0.54% on Wednesday. Reversing a 0.13% gain from Tuesday, the USD/JPY ended the day at 147.487. On Wednesday, the USD/JPY rose to a high of 148.384 before falling to a low of 146.651.
The Bank of Japan and Pivot Bets
On Thursday, investors must track Bank of Japan commentary throughout the session.
On Tuesday, Bank of Japan Governor Kazuo Ueda discussed the blueprint for exiting negative rates. Wage growth and the services sector were two focal points. In January, the Jibun Bank Services PMI unexpectedly increased from 51.5 to 52.7. Significantly, input prices rose at a more marked pace, with service sector firms also reporting a pickup in hiring.
Bank of Japan comments about the PMI numbers need consideration. Support for an April pivot from negative rates would affect buyer demand for the USD/JPY.
There are no economic indicators from Japan for investors to consider on Thursday.
The US Economic Calendar: US GDP and Jobless Claims in Focus
On Thursday, US GDP numbers for Q4 and the weekly jobless claims will garner investor interest.
Economists predict the US economy to expand by 2.0% quarter-on-quarter in Q4 The US economy grew by 4.9% in the previous quarter. Softer-than-expected GDP numbers could refuel bets on a March Fed rate cut. However, the devil will be in the details. Downward trends in disposable income, consumer spending, and inflation would raise bets on a March rate cut.
The GDP Report could give investors guidance on consumption and inflation. However, US labor market economic indicators remain pivotal for the Fed.
Tighter labor market conditions could allow the Fed to delay cutting rates until Q2. Improving labor market conditions would support wage growth and disposable income. Upward trends in disposable income could fuel consumer spending and demand-driven inflation.
A higher-for-longer Fed rate path could reduce disposable income and curb consumer spending.
Economists forecast US initial jobless claims to increase from 187k to 200k in the week ending January 20. Sub-210k would unlikely raise bets on a March rate cut.
Short-term Forecast
Near-term trends for the USD/JPY hinge on the outlook for US consumption and US inflation. Better-than-expected US GDP numbers, a tight labor market, and sticky US inflation could tilt monetary policy toward the US dollar. However, the USD/JPY remains at risk of a sharp correction if US inflation softens significantly.
USD/JPY Price Action
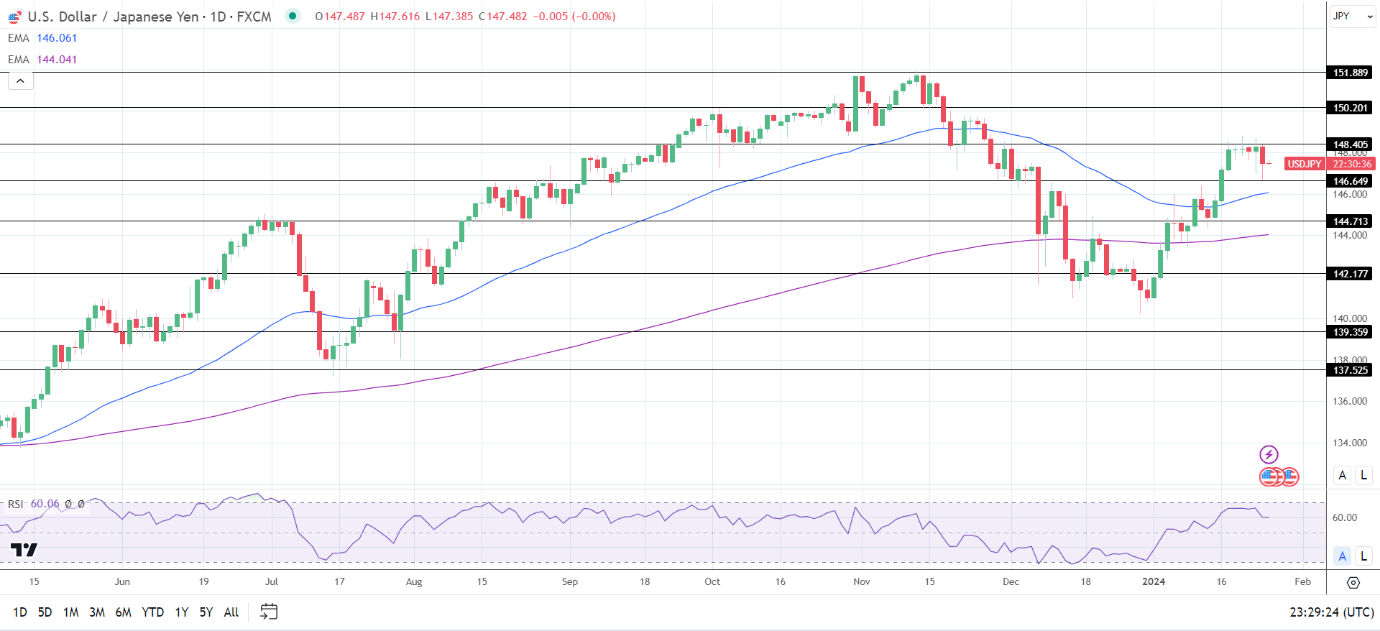
Daily Chart
The USD/JPY sat above the 50-day and 200-day EMAs, affirming bullish price signals.
A USD/JPY breakout from the 148.405 resistance level would bring the 150.201 resistance level into play.
On Thursday, the Bank of Japan, US GDP, and US jobless claims need consideration.
However, a drop below the 147 handle would support a fall to the 146.649 support level. A fall through the 146.649 support level would give the bears a run at the 50-day EMA.
The 14-day RSI at 60.06 indicates a USD/JPY break above the 148.405 resistance level before entering overbought territory.
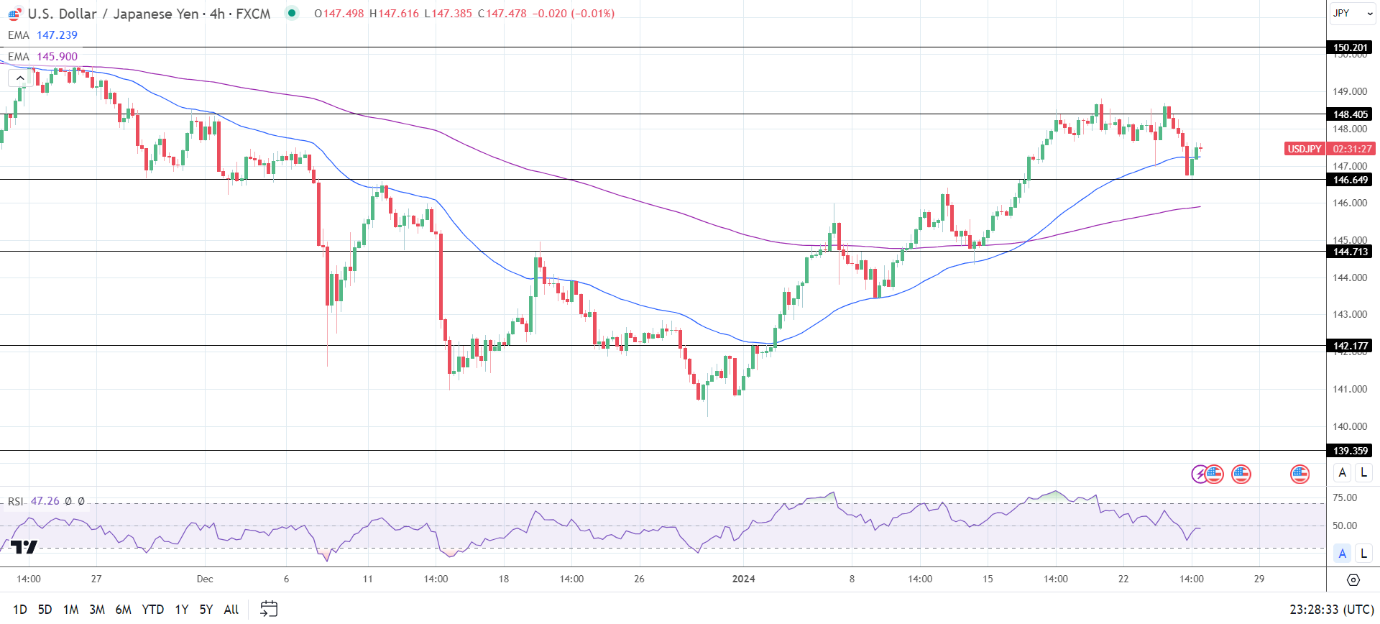
4-Hourly Chart
The USD/JPY remained above the 50-day and 200-day EMAs, reaffirming the bullish price signals.
A USD/JPY break above the 148.405 resistance level would support a move toward the 150.201 resistance level.
However, a pullback through the 50-day EMA would bring the 146.649 support level into play.
The 14-period 4-hour RSI at 47.26 indicates a USD/JPY break below the 146.649 support level before entering oversold territory.
About the Author
Bob Masonauthor
With over 20 years of experience in the finance industry, Bob has been managing regional teams across Europe and Asia and focusing on analytics across both corporate and financial institutions. Currently he is covering developments relating to the financial markets, including currencies, commodities, alternative asset classes, and global equities.
Did you find this article useful?
Latest news and analysis


Advertisement