
Advertisement
Advertisement
USD/JPY Forecast: BoJ Pivot Bets, US Producer Prices, and Fed Chatter in Focus
By:
Economic dynamics impact on the BoJ's pivot from negative rate plans, while US inflation keeps the focus on the Fed's interest rate goals.

In this article:
Highlights
- The USD/JPY declined by 0.34% on Thursday, ending the session at 145.260.
- Rising bets on a March Fed rate cut left the USD/JPY in negative territory despite the hotter-than-expected US CPI numbers.
- On Friday, the markets will focus on Bank of Japan commentary, US producer prices, and Fed chatter.
USD/JPY Movements on Thursday
The USD/JPY declined by 0.34% on Thursday. Partially reversing a 0.89% gain from Wednesday, the USD/JPY ended the session at 145.260. The USD/JPY rose to a high of $146.413 before falling to a low of 145.207.
Current Account Data and Bank of Japan Chatter
On Friday, current account figures from Japan drew interest. The current account surplus narrowed from 2,582.8 billion Yen to 1,925.6 billion Yen in November. Economists forecast a current account surplus of 2,385.1 billion Yen.
Market reaction to the narrowing was relatively limited. Investors remain focused on the Bank of Japan amidst fading plans to exit negative interest rates.
Recent inflation, household spending, and wage growth figures eased pressure on the BoJ to pivot from negative rates. However, the focus remains on the March wage negotiations that could pressure the BoJ to exit negative rates.
Near-term, monetary policy, and negative rates remain the focal points. Investors must monitor BoJ commentary on Friday.
US Producer Prices and the Fed
On Friday, US producer prices will garner investor interest. After the hotter-than-expected US CPI Report, a pickup in producer prices could test bets on a March Fed rate cut. Producers raise prices in an improving demand environment, passing costs to consumers.
As a leading indicator for consumer price inflation, an upward trend in producer prices could influence the Fed. A higher-for-longer Fed rate path could impact disposable income. Downward trends in disposable income could curb spending and dampen demand-driven inflation.
Economists forecast producer prices to increase by 0.1% in December after a flat November. However, economists expect core producer prices to rise by 0.2% after stalling in November. Year-over-year, economists predict core consumer prices to increase by 1.9% (Nov: 2.0%). However, economists forecast producer prices to rise 1.3% year-over-year (Nov: 0.9%).
With producer prices in focus, investors must monitor Fed chatter. Reaction to the US CPI Report and producer prices need consideration. FOMC member Neel Kashkari is on the calendar to speak on Friday.
Short-term Forecast
Near-term trends for the USD/JPY hinge on US producer prices and central bank commentary. A marked increase in producer prices could force the Fed to delay the timing of a rate cut. Receding bets on a BoJ exit from negative rates and Fed rate cut delays could swing monetary policy divergence toward the US dollar.
USD/JPY Price Action
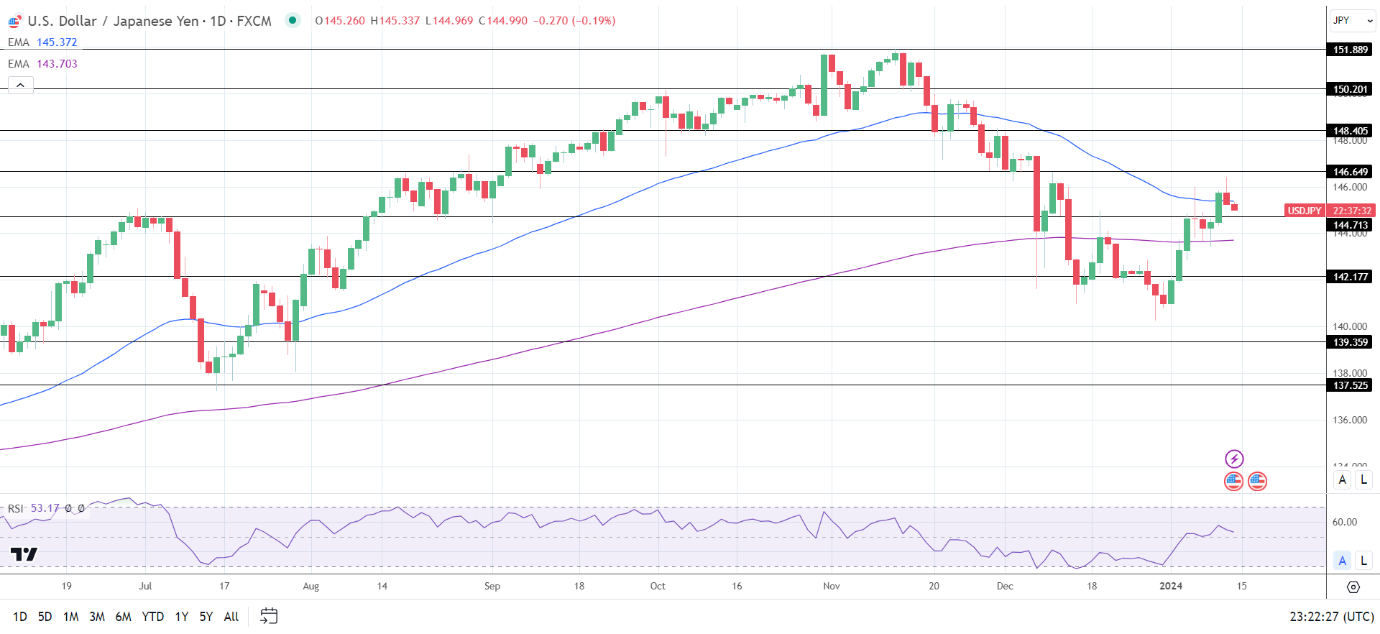
Daily Chart
The USD/JPY held below the 50-day EMA while remaining above the 200-day EMA, sending bearish near-term but bullish longer-term price signals.
A USD/JPY break above the 50-day EMA would support a move to the 146.649 resistance level.
On Friday, the focus will be on central bank commentary and US producer prices.
However, a fall through the 144.713 support level would give the bears a run at the 200-day EMA.
The 14-day RSI at 53.17 suggests a USD/JPY move through the 146.649 resistance level before entering overbought territory.
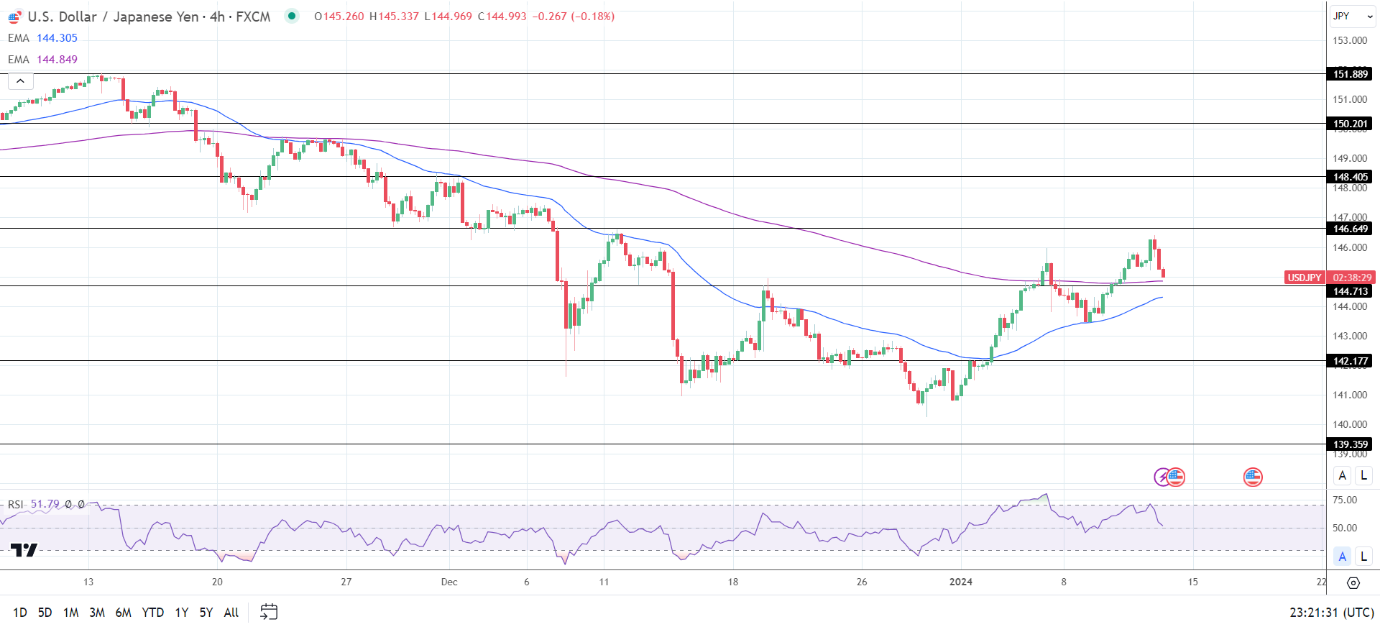
4-Hourly Chart
The USD/JPY remained above the 50-day and 200-day EMAs, sending bullish price signals.
A USD/JPY return to the 146 handle would support a move to the 146.649 resistance level.
However, a break below the 200-day EMA and the 144.713 support level would bring the 50-day EMA into play.
The 14-period 4-hour RSI at 51.79 suggests a USD/JPY break above the 146.649 resistance level before entering overbought territory.
About the Author
Bob Masonauthor
With over 20 years of experience in the finance industry, Bob has been managing regional teams across Europe and Asia and focusing on analytics across both corporate and financial institutions. Currently he is covering developments relating to the financial markets, including currencies, commodities, alternative asset classes, and global equities.
Did you find this article useful?
Latest news and analysis


Advertisement