
Advertisement
Advertisement
AUD/USD Forecast: Beijing’s Influence and the US Economic Calendar
By:
Aussie dollar's fortunes tied to Beijing's stimulus expectations as China remains a key player in Australian exports.

In this article:
Highlights
- The AUD/USD declined by 0.48% on Wednesday, ending the session at $0.67299.
- US Consumer Confidence figures for December pulled the AUD/USD into negative territory.
- On Thursday, Beijing and the US economic calendar are the focal points.
Wednesday Overview of the AUD/USD
The AUD/USD declined by 0.48% on Wednesday. After a 0.84% rally on Wednesday, the Australian dollar ended the Wednesday session at $0.67299. The Australian dollar rose to a high of $0.67791 before sliding to a low of $0.67241.
Beijing Remains in Focus as Riskier Assets Struggle
On Thursday, investors could redirect their attention to Beijing. The markets expect a stimulus package to bolster the Chinese economy. A lack of a meaningful package could test the appetite for the Aussie dollar.
China accounts for one-third of Australian exports. Increased demand from China could be a boon for the Australian economy and the Aussie dollar. Australia has a trade-to-GDP ratio above 50%, with 20% of the workforce in trade-related jobs.
Tighter Australian labor market conditions could fuel wage growth and consumer spending. Australian private consumption contributes over 50% to the economy.
There are no economic indicators from Australia or China to influence buyer demand for the Australian dollar. However, FedEx (FDX) cut its revenue forecasts overnight. The adjustments could reignite fears of a global recession and affect supply-demand expectations. A weaker demand outlook would impact commodity currencies, including the Aussie dollar.
US Jobless Claims, Philly Fed Manufacturing, and GDP in Focus
On Thursday, Q3 GDP, Philly Fed Manufacturing, and initial jobless claims will garner investor interest. However, barring revisions to the Q3 GDP numbers, jobless claims and Philly Fed Manufacturing figures would impact the AUD/USD pair more.
Tight labor market conditions support wage growth and disposable income. An upward trend in disposable income could fuel consumer spending and demand-driven inflation. The net effect could be for the Fed to maintain interest rates at current levels for longer to curb spending.
Economists forecast initial jobless claims to increase from 202k to 215k
The Philly Fed Manufacturing Index could influence bets on a soft landing. However, the manufacturing sector accounts for less than 30% of the US economy, limiting its influence on the Fed.
Economists expect the Philly Fed Manufacturing Index to increase from -5.9 to -3.0 in December.
Short-Term Forecast
Near-term AUD/USD trends may hinge on the Personal Consumption Expenditures Report, out on Friday. Softer-than-expected US inflation figures could tilt monetary policy divergence more toward the Aussie dollar. China stimulus would also drive buyer demand for the Aussie dollar.
AUD/USD Price Action
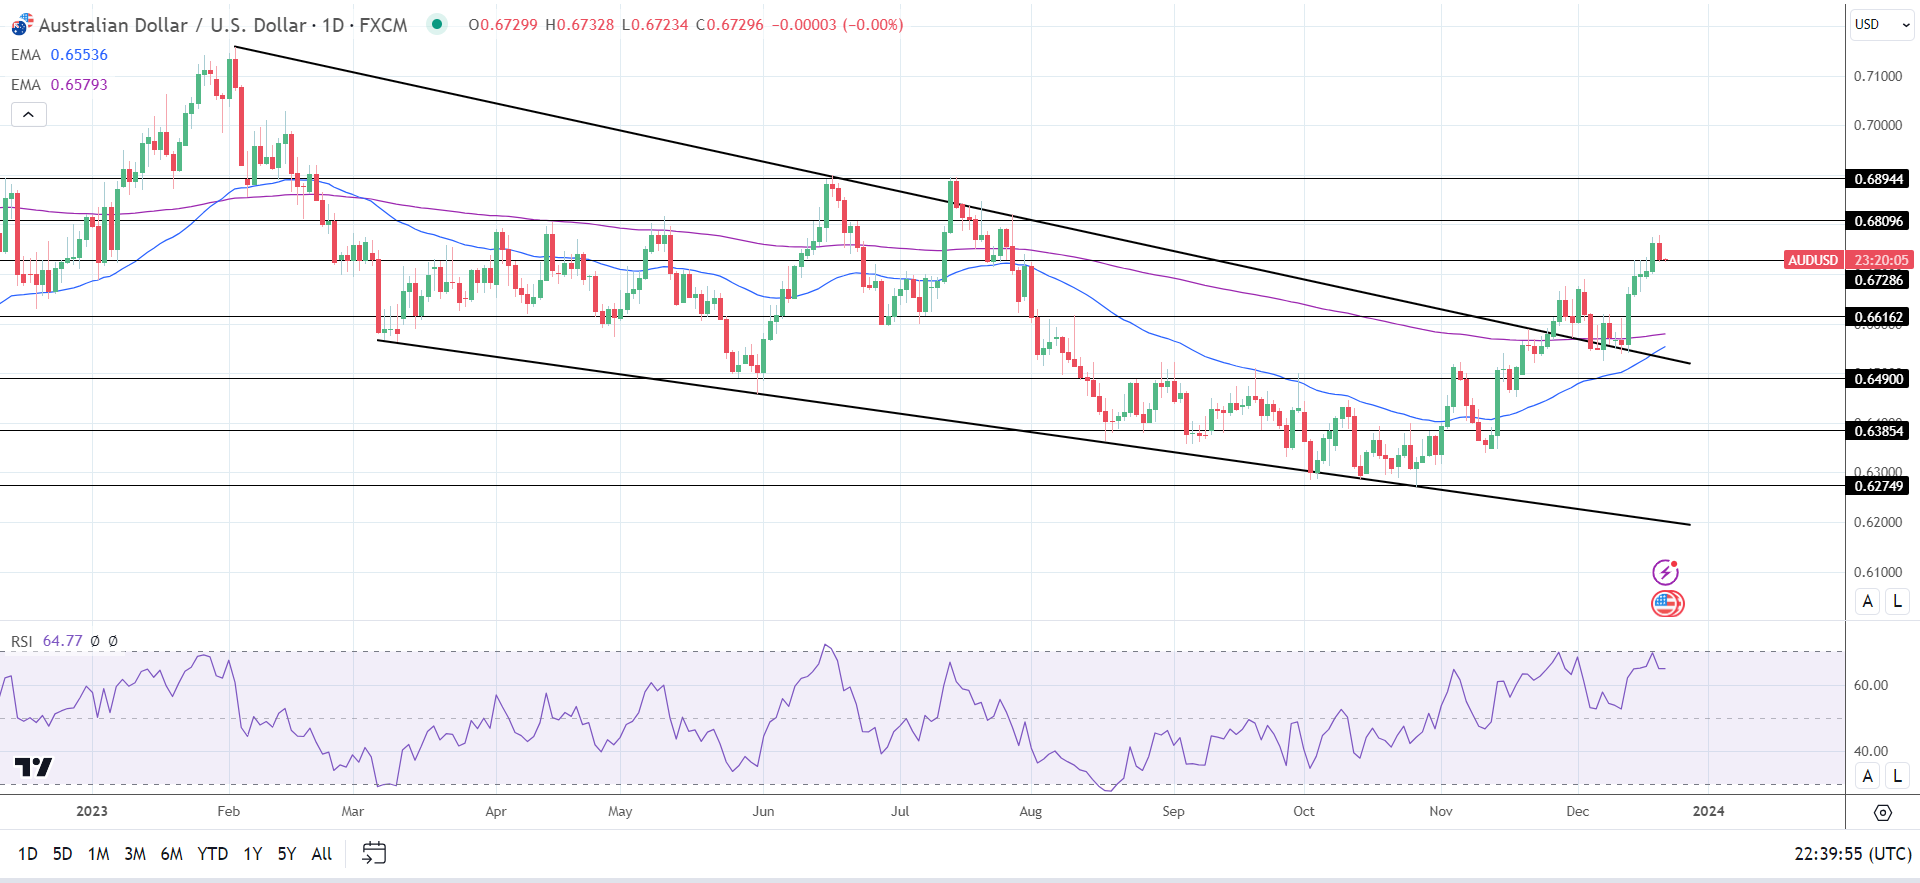
Daily Chart
The AUD/USD remained above the 50-day and 200-day EMAs, affirming bullish price signals.
An AUD/USD return to the $0.67500 handle would support a move to the $0.68096 resistance level.
Beijing and the US economic calendar will influence the appetite for the AUD/USD.
However, a break below the $0.67286 support level would give the bears a look at sub-$0.67 and the $0.66162 support level.
A 14-period Daily RSI reading of 64.77 suggests an AUD/USD move to the $0.68296 resistance level before entering overbought territory (typically above 70 on the RSI scale).
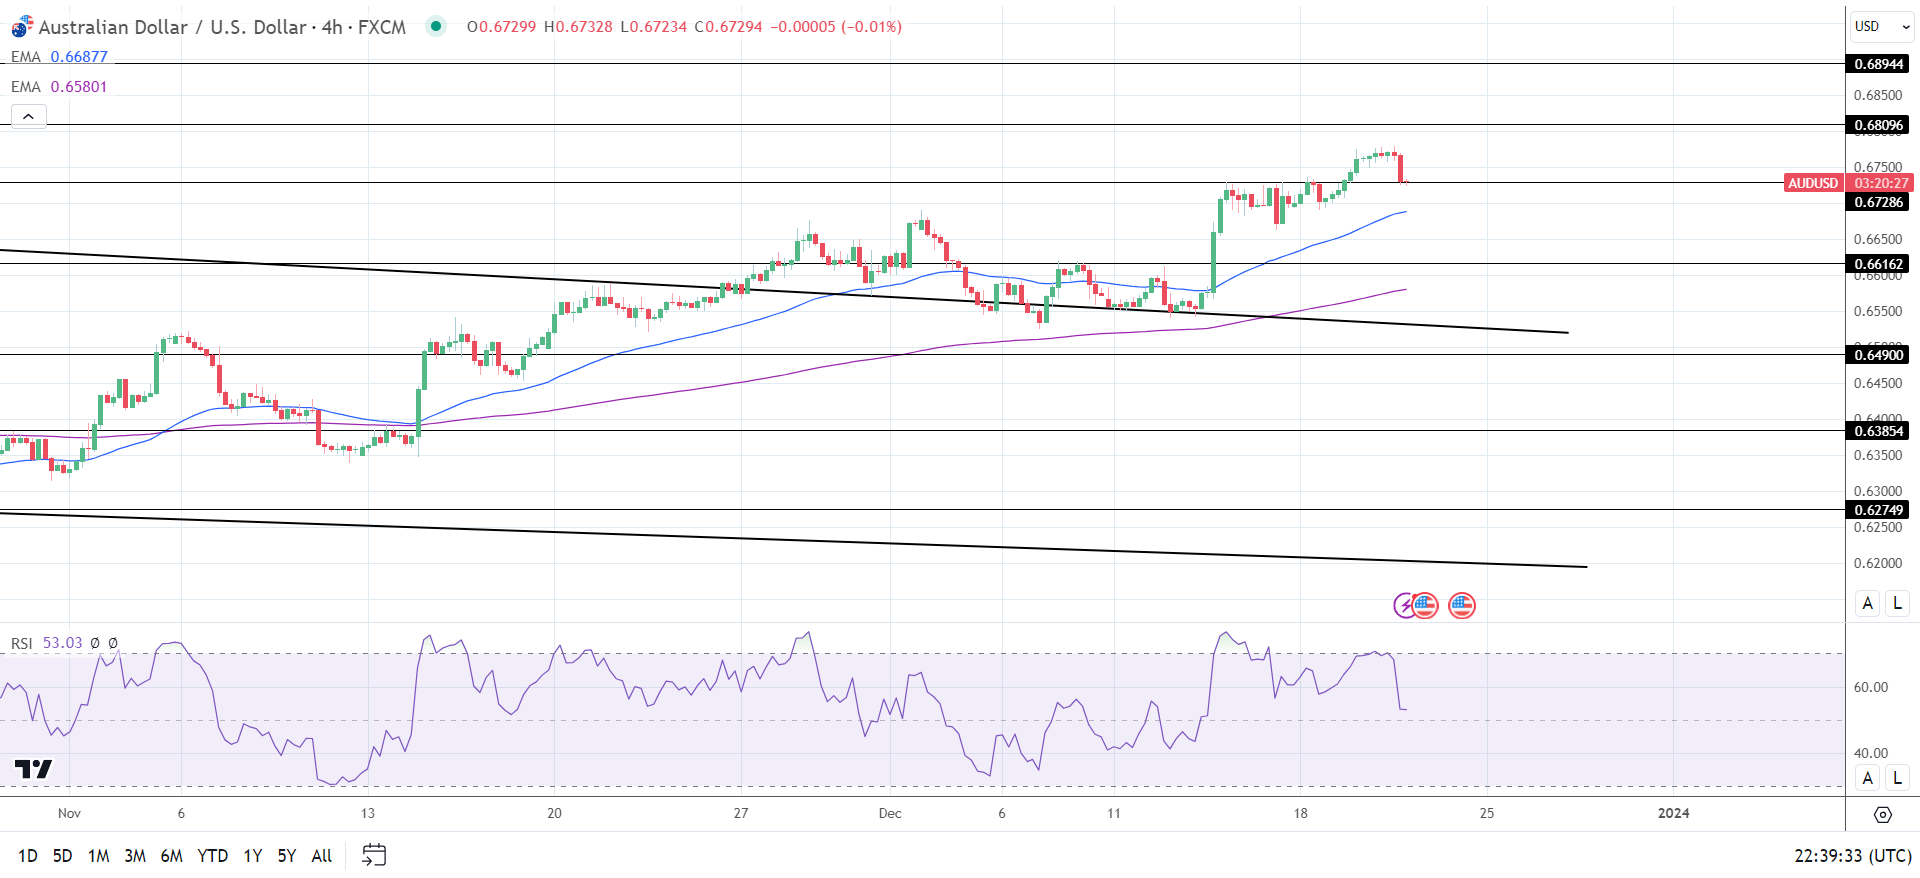
4-Hourly Chart
The AUD/USD sat above the 50-day and 200-day EMAs, reaffirming bullish price signals.
An AUD/USD break above the $0.67500 handle would give the bulls a run at the $0.68096 resistance level.
However, a fall through the $0.67286 support level would bring the 50-day EMA into play.
The 14-period 4-Hourly RSI at 53.03 indicates an AUD/USD move to the $0.68296 resistance level before entering overbought territory.
About the Author
Bob Masonauthor
With over 20 years of experience in the finance industry, Bob has been managing regional teams across Europe and Asia and focusing on analytics across both corporate and financial institutions. Currently he is covering developments relating to the financial markets, including currencies, commodities, alternative asset classes, and global equities.
Did you find this article useful?
Latest news and analysis


Advertisement