
Advertisement
Advertisement
USDJPY, AUDUSD and NZDUSD Forecast: JPY Steady Above 151.70 Awaiting CPI Clue
By:
USD/JPY steadies, traders await CPI data for new rate hike insights. RBA's rate hike dampens AUD, consumer sentiment reflects caution ahead.

In this article:
Key Insights
- USD/JPY poised above key support, reflecting a bullish undertone.
- Australian consumer sentiment falters, signaling potential market shifts.
- NZD/USD treads near pivotal EMA, with potential to sway market sentiment.
Quick Fundamental Outlook
The U.S. dollar soared to a year-plus peak against the Japanese yen, approaching the significant level of 152, before a swift decline influenced by substantial options expirations.
A potential subdued U.S. CPI report could signal an end to the Fed’s rate hikes, influencing Treasury yields and dollar stability. In contrast, Australian consumer confidence dipped in November, impacted by the Reserve Bank’s rate increase and inflationary pressures.
The Westpac survey indicated a stark rise in the number of consumers bracing for higher mortgage rates, with the drop in sentiment casting a shadow over festive season spending, hinting at a cautious retail outlook.
USD/JPY Prices Forecast
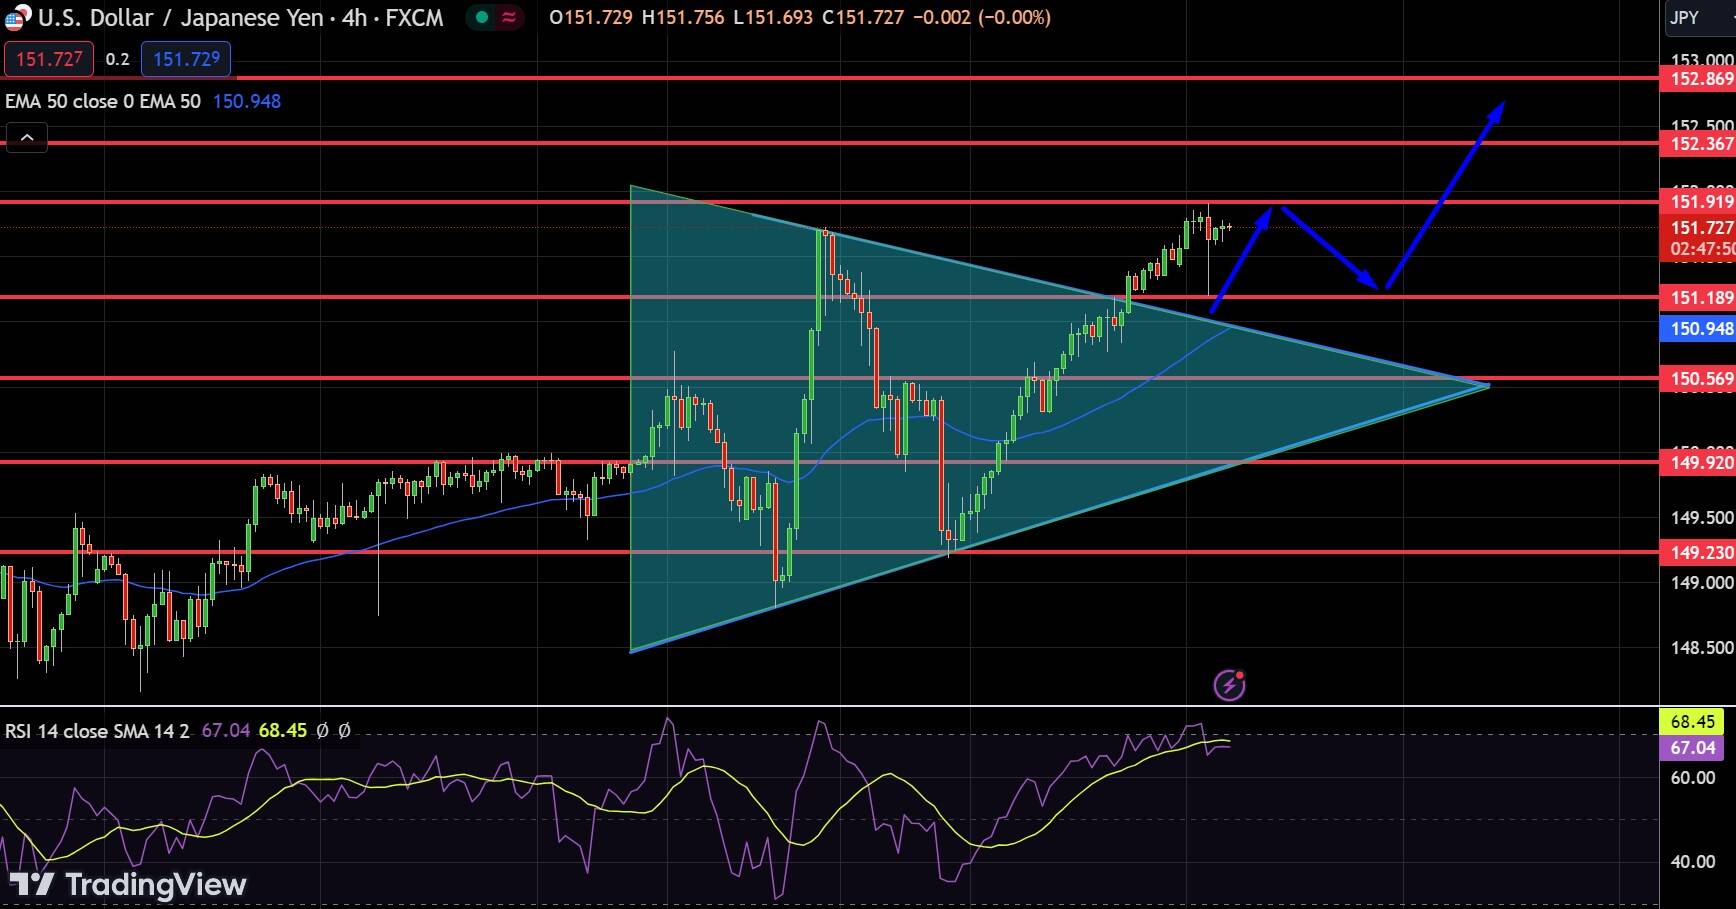
In the realm of foreign exchange, the USD/JPY pair presents a tableau of both persistence and pause, as it holds its ground at 151.72. The currency pair’s stability belies the undercurrents of market dynamics that, at this juncture, sway between anticipation and action.
The currency duo has found itself in a delicate equilibrium, with the current technical posture echoing a sentiment of attentiveness among traders. The Relative Strength Index (RSI) stands at a poised 67, not quite tipping into overbought territory, suggesting that bullish sentiment still has room to maneuver before hitting a ceiling of market consensus.
This is further substantiated by the price’s comfortable placement above the 50 EMA at 150.95, a vantage point that implies a sustained bullish trend in the short term. However, the market, much like a coiled spring, contains potential energy awaiting release.
Key price levels loom overhead, with immediate resistance etched at 151.919, a threshold that if crossed, could beckon further ascents towards 152.869. Conversely, immediate support hovers at 150.569, a level whose breach would potentially beckon a descent, unraveling the pair’s recent gains.
With eyes set on the horizon, the overarching trend for USD/JPY remains cautiously bullish, contingent on its continued affirmation above critical technical benchmarks.
AUD/USD Prices Forecast
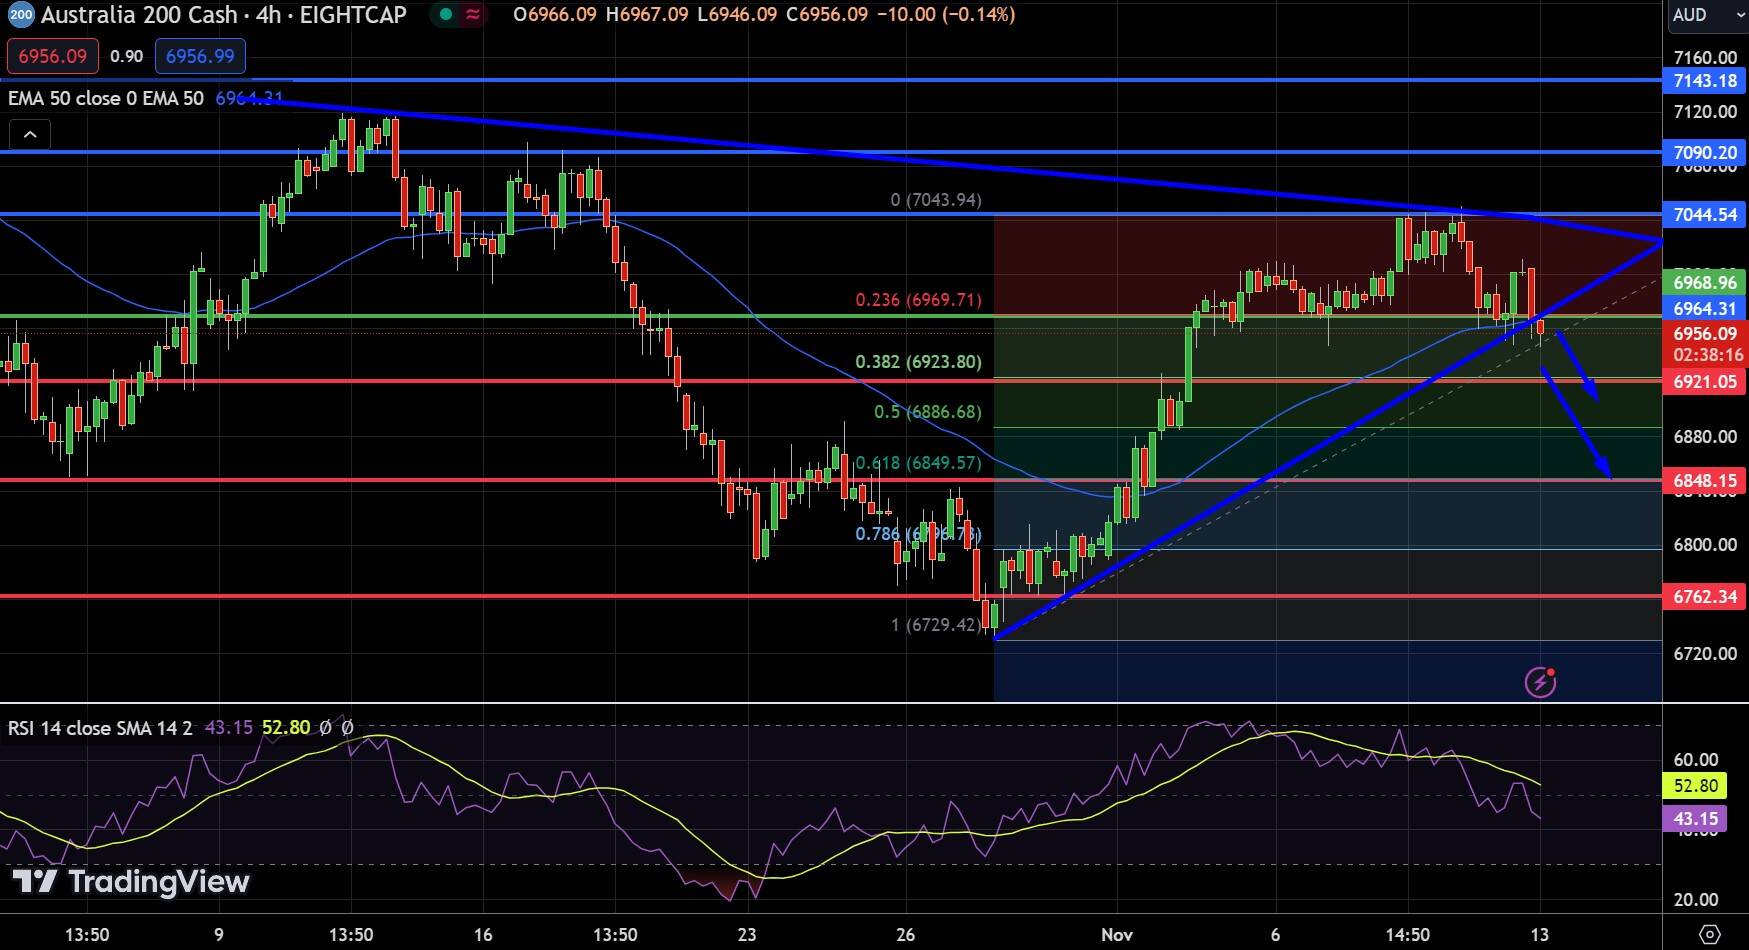
The AUD/USD is navigating choppy waters as it hovers around $0.6368, with a slight 24-hour decline. As it stands, the currency finds itself teetering on a pivot point of $0.6391, with eyes cast toward immediate resistances at $0.6439 and beyond. Should the bullish winds favor the Aussie, we may see an ascent toward the key resistance level of $0.6520.
In the trenches of technical analysis, the Relative Strength Index (RSI) stands at 36.81, lingering close to the oversold territory. This suggests a market ripe for a potential rebound if the currency garners enough buying interest. Meanwhile, the MACD displays a hint of bearish momentum, yet without a definitive crossover, it keeps market spectators on the edge of their seats.
The currency’s voyage is further complicated by its position relative to the 50 EMA, which at $0.6391, serves as a beacon of the short-term trend. Currently trading below this marker, the AUD/USD pair shows signs of bearish pressure but also the prospect of a bullish resurgence should it breach and hold above this dynamic level of sentiment.
The conclusion drawn from these technical signposts is one of caution; the AUD/USD pair seems to be in a liminal phase, with the potential to swing in either direction.
The immediate trajectory will likely be influenced by its ability to break through the immediate resistances or succumb to support levels beneath, particularly around $0.6315 and $0.6286. The coming days are poised to be critical for the Aussie, as it tests these waters and reveals its true course.
NZD/USD Prices Forecast
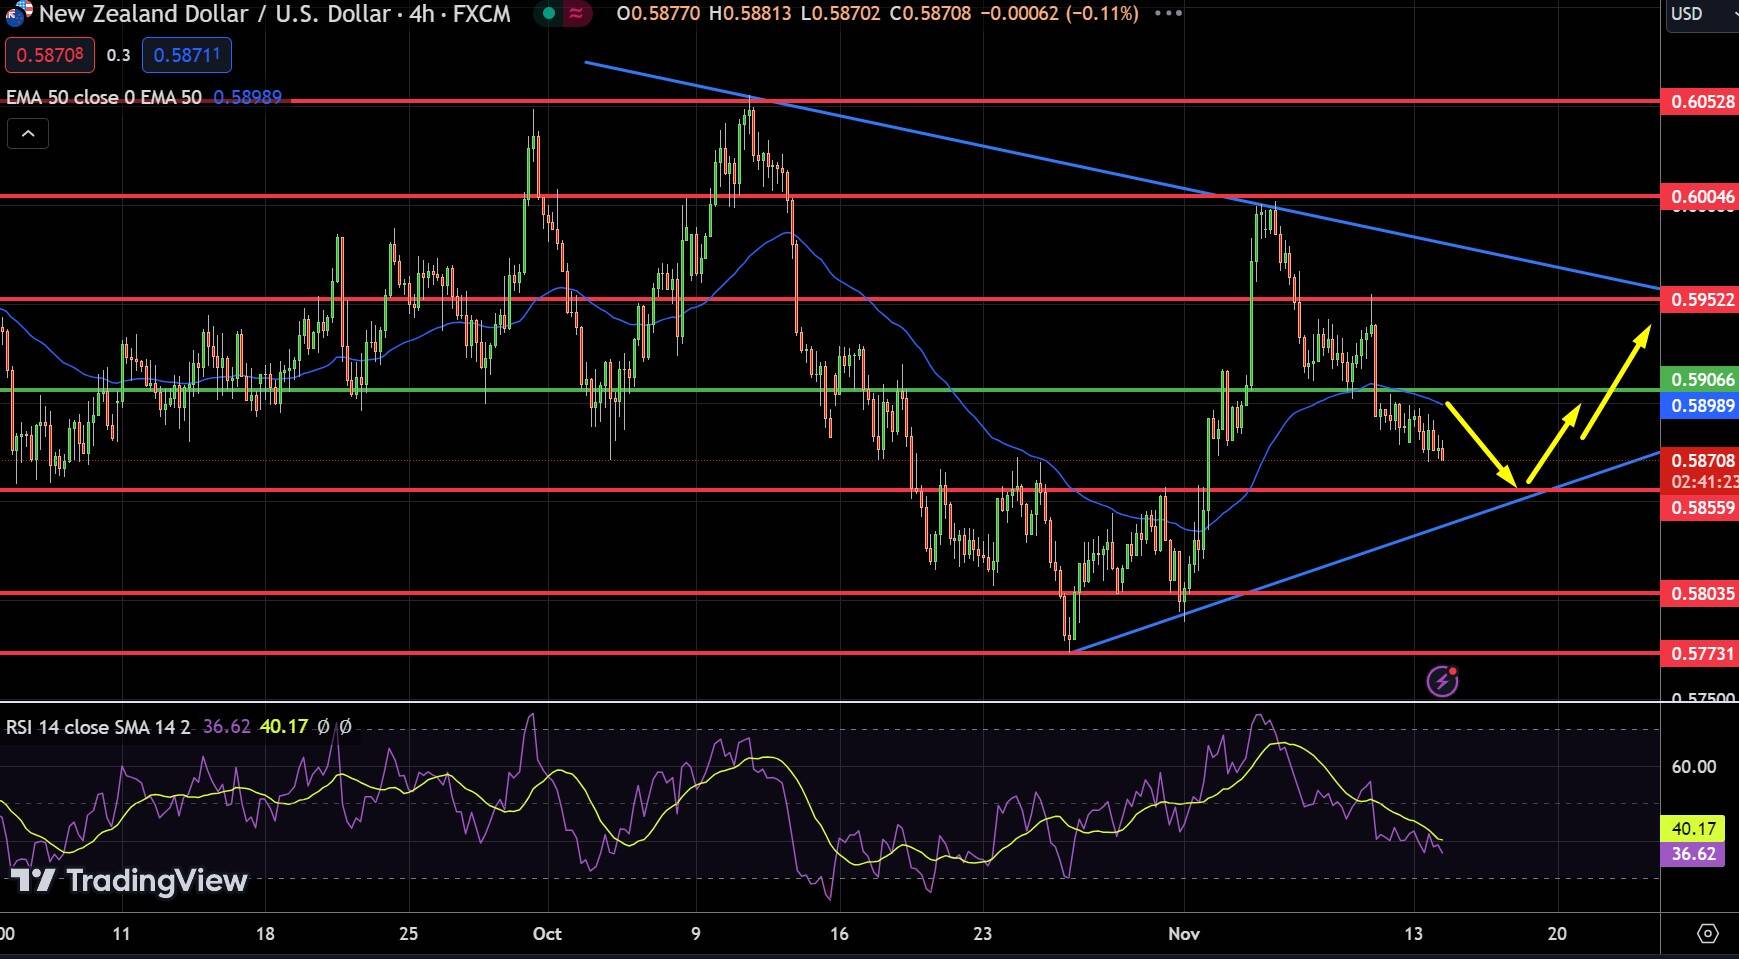
In today’s foreign exchange market, the New Zealand Dollar (NZD/USD) presents a technical conundrum, hovering at $0.58708, with a marginal 24-hour dip. A closer look at the technical landscape reveals a current trading price that’s flirting with the 50-day Exponential Moving Average (EMA) set at $0.58989.
Immediate support levels lie at $0.5855, and if breached, the door opens to the next support at $0.57731, potentially inviting further bearish momentum. The Relative Strength Index (RSI) reading stands at 40.17, which leans toward neither overbought nor oversold territories, suggesting a neutral market sentiment.
Chart patterns indicate that NZD/USD is navigating within a converging range, hinting at a breakout in either direction. The market waits with bated breath for a catalyst that could tip the scales and set a definitive direction.
For a look at all of today’s economic events, check out our economic calendar.
About the Author
Arslan Aliauthor
Arslan, a webinar speaker and derivatives analyst, has an MBA in Finance and MPhil in Behavioral Finance. He guides financial analysis, trading, and cryptocurrency forecasting. Expert in trading psychology and sentiment.
Did you find this article useful?
Latest news and analysis


Advertisement