
Advertisement
Advertisement
USD/JPY Forecast: The US Labor Market and the Fed in Focus Amid Intervention Hype
By:
USD/JPY's short-term forecast: From intervention concerns to a hawkish Fed, factors shaping the Yen's path to 152.

In this article:
Highlights
- The USD/JPY rallied 1.75% on Tuesday, ending the session at 151.666.
- Finalized private sector PMIs from Japan and intervention will be early discussion points on Wednesday.
- However, US labor market numbers and the Fed warrant more consideration.
Tuesday Overview of USD/JPY Movements
The USD/JPY rallied 1.75% on Tuesday. Reversing a 0.36% fall from Monday, the USD/JPY ended the session at 151.666. The USD/JPY fell to a low of 149 001 before striking a high of 151.723.
Intervention Threats to Test the USD/JPY at 151
On Wednesday, finalized private sector PMIs for October drew investor interest. The Jibun Bank Manufacturing PMI increased from 48.5 to 48.7 vs. a prelim 48.5. However, the upward revision had a limited impact on the Yen despite the continued contraction.
Market speculation of an intervention to bolster the Yen pressured the USD/JPY. The Bank of Japan-induced slide to 151 caused a stir on Tuesday. The BoJ tweaked the Yield Curve Control Policy.
However, Japanese government measures to support the economy contributed to early USD/JPY losses. The Japanese government is reportedly working on a 17 trillion Yen package to counter the impact of inflation on the economy.
There are no upcoming economic indicators from Japan later in the morning. The lack of stats will expose the USD/JPY to warnings of an intervention.
The US Labor Market and the Fed in the Spotlight
On Wednesday, US ADP nonfarm employment change and JOLTs Job Openings will garner investor interest. Hotter-than-expected labor market numbers could leave a Fed rate hike on the table.
Economists forecast the ADP to report a 150k increase in employment vs. 89k in September. However, economists expect JOLTs Job openings to fall from 9.61 million to 9.25 million in September.
Tighter labor market conditions support wage growth, fueling consumption and demand-driven inflation. An upward trend in wage growth and consumption could force the Fed to take a more hawkish rate path. A higher-for-longer interest rate environment would impact borrowing costs and disposable income.
A downward trend in disposable income could force consumers to curb spending, easing pressure on the Fed to take a more hawkish rate path.
While the numbers will draw interest, the Fed interest rate decision and press conference will be the focal point. A hawkish hold on interest rates could drive buyer appetite for the US dollar.
Short-term Forecast
Near-term USD/JPY trends hinge on US labor market numbers and the Fed. A hawkish Fed and better-than-expected labor market numbers would support a USD/JPY move to 152. However, intervention threats also need consideration at current levels.
USD/JPY Price Action
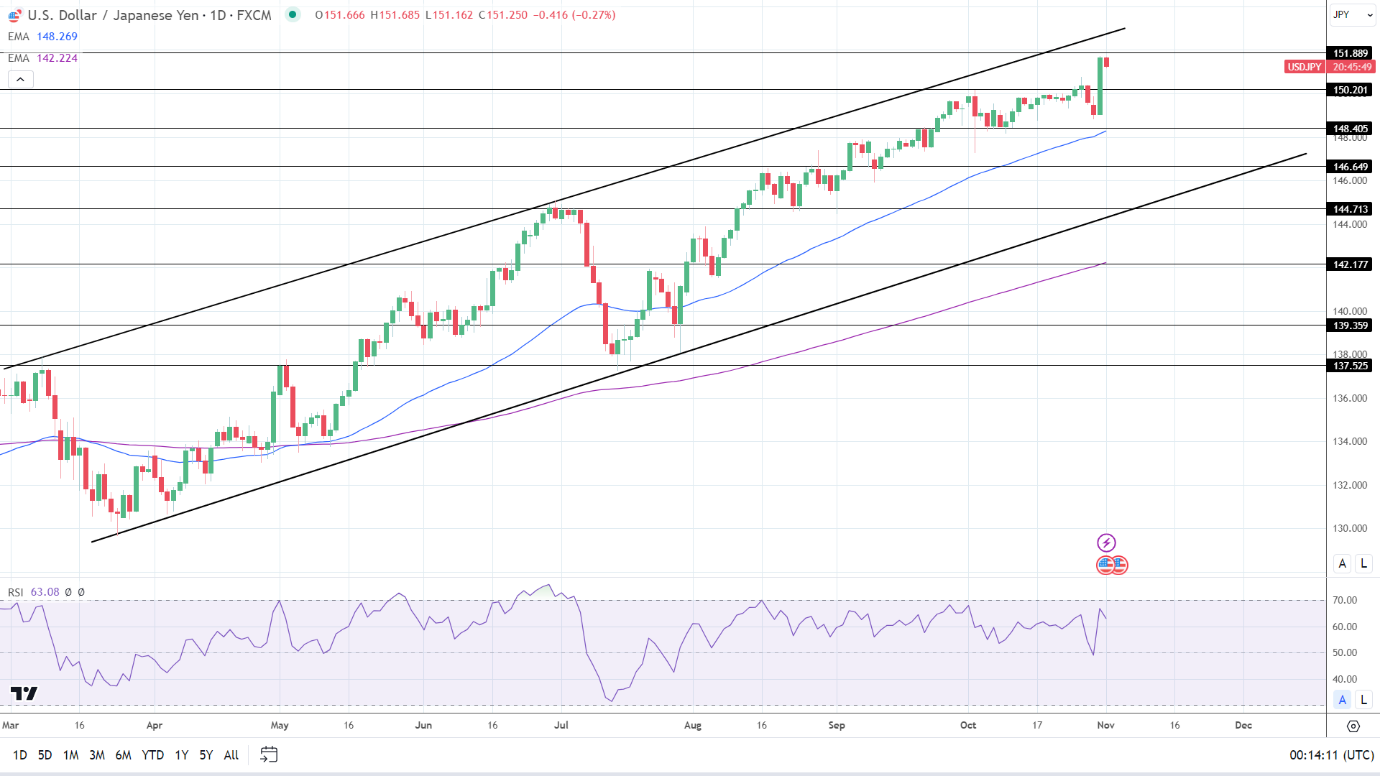
Daily Chart
The USD/JPY remained above the 50-day and 200-day EMAs, affirming bullish price signals. A USD/JPY break above the 151.889 resistance level would support a move to the trend line.
Intervention threats and the Fed will be focal points during the Wednesday session.
A break below the 150.201 support level in USD/JPY would open the door for the bears to target the 148.405 support level and the 50-day EMA. Buying appetite will likely intensify at 148.400. The 50-day EMA is confluent with the 148.405 support level.
The 14-day RSI at 63.08 indicates a USD/JPY break above the 151.889 resistance level before entering overbought territory.
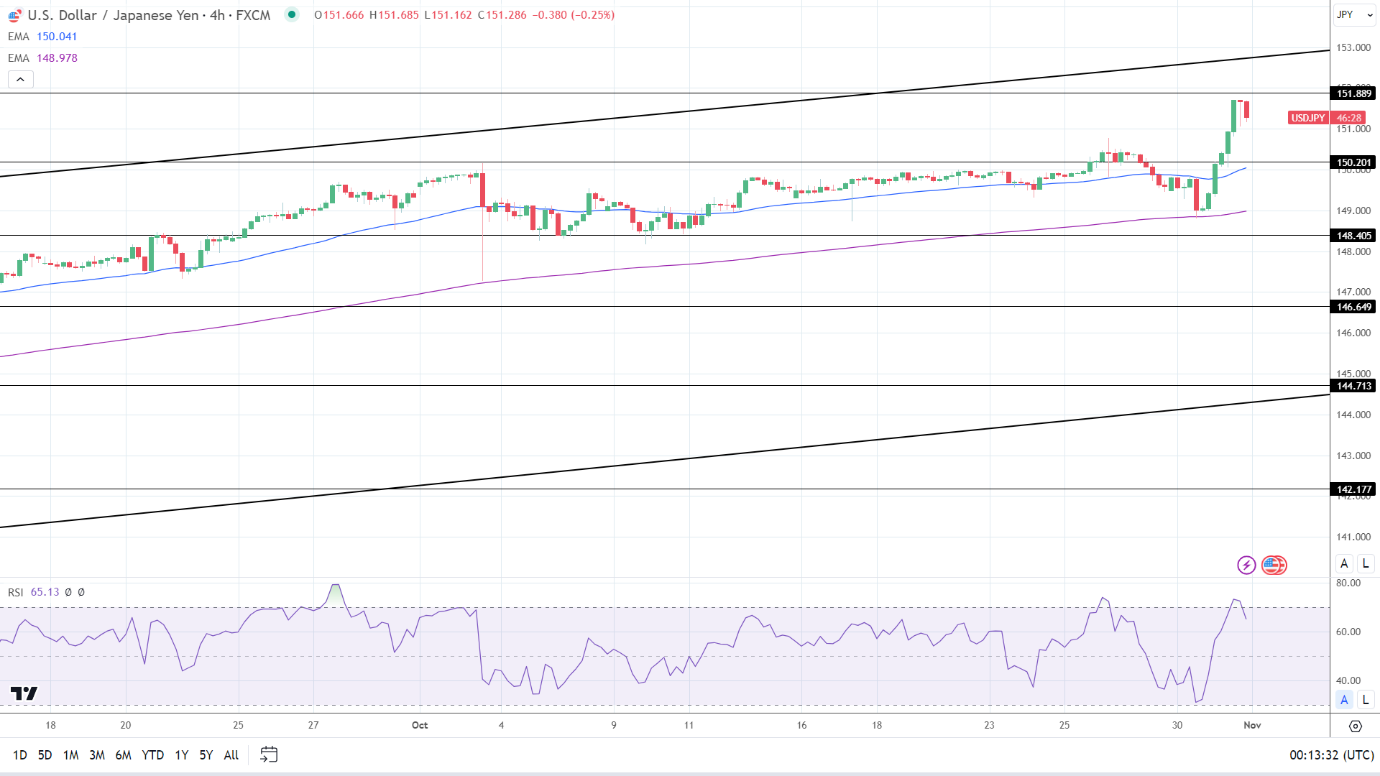
4-Hourly Chart
The USD/JPY holds above the 50-day and 200-day EMAs, reaffirming bullish price signals.
A USD/JPY break above the 151.889 resistance level would support a move to the trend line.
However, a drop below 151 would give the bears a run at the 150.201 support level and the 50-day EMA.
The 14-period 4-hourly RSI at 65.13 indicates a USD/JPY move to the 151.889 resistance level before entering overbought territory.
About the Author
Bob Masonauthor
With over 20 years of experience in the finance industry, Bob has been managing regional teams across Europe and Asia and focusing on analytics across both corporate and financial institutions. Currently he is covering developments relating to the financial markets, including currencies, commodities, alternative asset classes, and global equities.
Did you find this article useful?
Latest news and analysis


Advertisement