
Advertisement
Advertisement
AUD to USD Forecast: Aussie Climbs as Inflation Spurs RBA Rate Hike Bets
By:
Expect AUD/USD trends to shift based on upcoming US GDP and inflation data, following Australia's hotter-than-expected CPI report.

In this article:
Highlights
- The AUD/USD rose by 0.31% on Tuesday, ending the session at $0.63545.
- On Wednesday, Q3 Australian inflation figures fueled bets on an RBA interest rate hike. The Monthly CPI Indicator accelerated from 5.2% to 5.6%.
- Later in the session, US housing sector data needs consideration ahead of the US inflation numbers on Friday.
Tuesday Overview
On Tuesday, the AUD/USD rose by 0.31%. Following a 0.40% gain on Monday, the Aussie dollar ended the day at $0.63545. The Aussie dollar fell to a low of $0.63296 before rising to a high of $0.63790.
Australian Inflationary Pressures Return to Test the RBA
On Wednesday, Australian inflation figures for Q3 garnered investor interest. The Monthly CPI Indicator rose from 5.2% to 5.6% in September, reflecting a pickup in inflationary pressure at the end of Q3. Economists forecast an inflation rate of 5.4%.
Prices for housing (+7.2%), transport (+9.4%), and food and non-alcoholic beverages (+4.7%) had the most significant contributions to the monthly indicator.
According to the ABS,
- Consumer prices increased by 1.2% in Q3 quarter-on-quarter, up from 0.8% in Q2.
- Automotive fuel (+7.2%), rents (+2.2%), new dwelling purchases (+1.3%), and electricity (+4.2%) were the most marked contributors.
- The annual inflation rate softened from 6.0% to 5.4% in Q3 quarter-on-quarter. Inflation softened for the third consecutive quarter.
- Significantly, annual services inflation softened for the first time since December 2021 but remained elevated.
The Aussie dollar responded to the numbers, with investors raising bets on an RBA rate hike. On Tuesday, RBA Assistant Governor Michelle Bullock reportedly said,
“The Board will not hesitate to raise the cash rate further if there is a material upward revision to the outlook for inflation.”
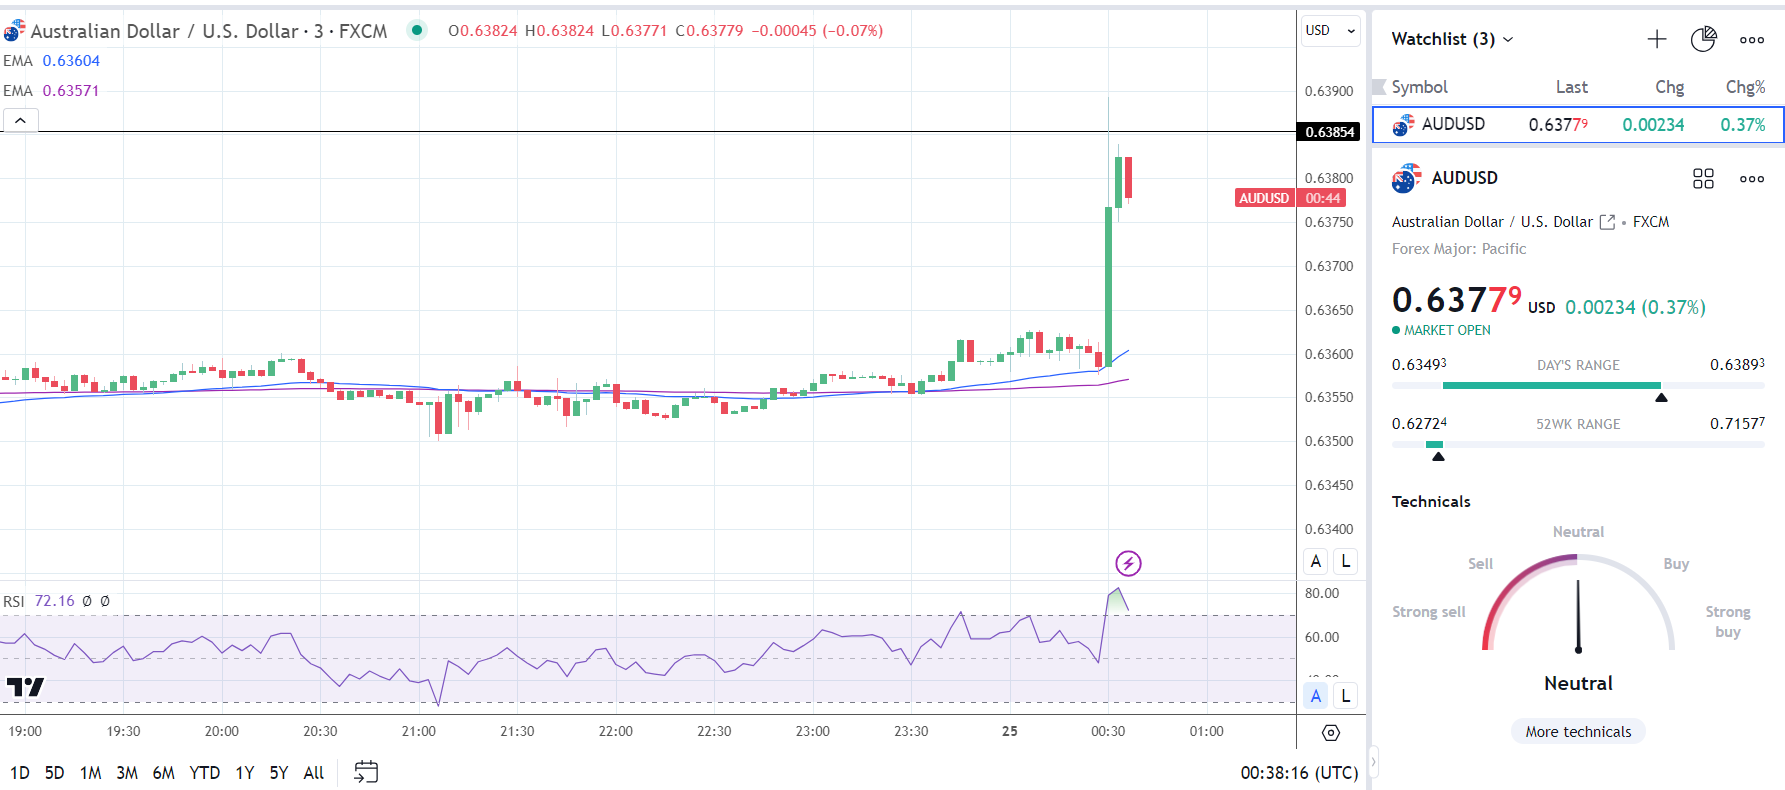
The AUD/USD rallied from $0.63586 to $0.63893.
US Housing Sector in Focus
The US housing sector will be in the spotlight on Wednesday. New home sales figures for September will warrant consideration. The US housing sector contributes less than 10% to the US economy. However, a higher mortgage rate environment impacts consumer confidence and spending.
A negative outlook on consumption would impact the US economy and ease demand-driven inflationary pressures. US private consumption contributes over 65% to the US economy.
Economists forecast new home sales to decline by 11.0% in September (Aug: -8.7%).
Short-Term Forecast
Near-term trends for the AUD/USD over the next week may hinge on the US GDP and inflation figures. After the Australian CPI Report, softer US inflation figures on Friday could tip monetary policy divergence toward the Aussie dollar.
AUD/USD Price Action
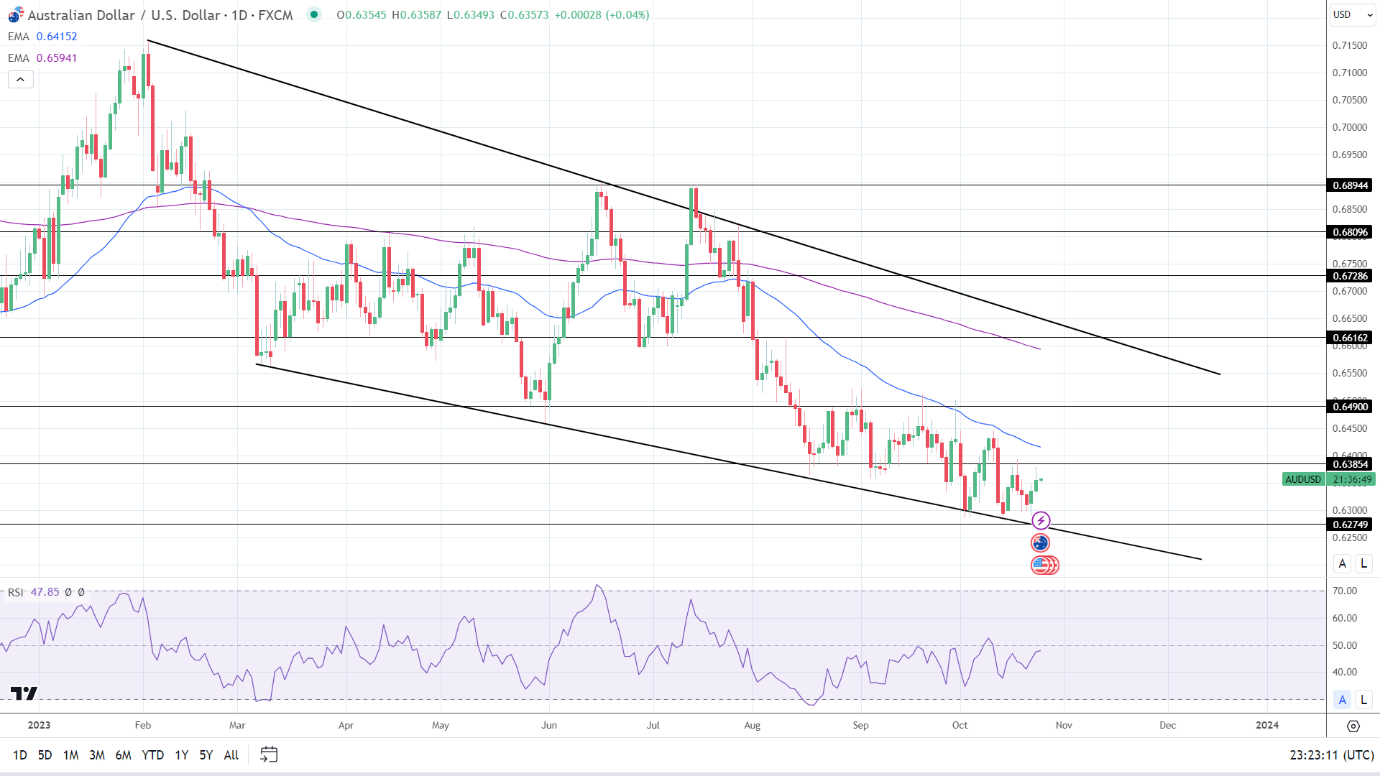
Daily Chart
The AUD/USD sat below the 50-day and 200-day EMAs, affirming bearish price signals.
A break and hold above the $0.63854 resistance level would support a move to the 50-day EMA. Market sentiment toward RBA monetary policy and market risk appetite will likely guide the Aussie dollar.
However, a fall through the Tuesday session low of $0.63296 would support a move to the trend line and 0.62749 support level. Buying pressure will likely intensify at $0.62750. The trend line is confluent with the support level.
A 14-period Daily RSI reading of 47.85 indicates an AUD/USD move to the $0.62749 support level and the trend line before entering oversold territory (typically below 30 on the RSI scale).
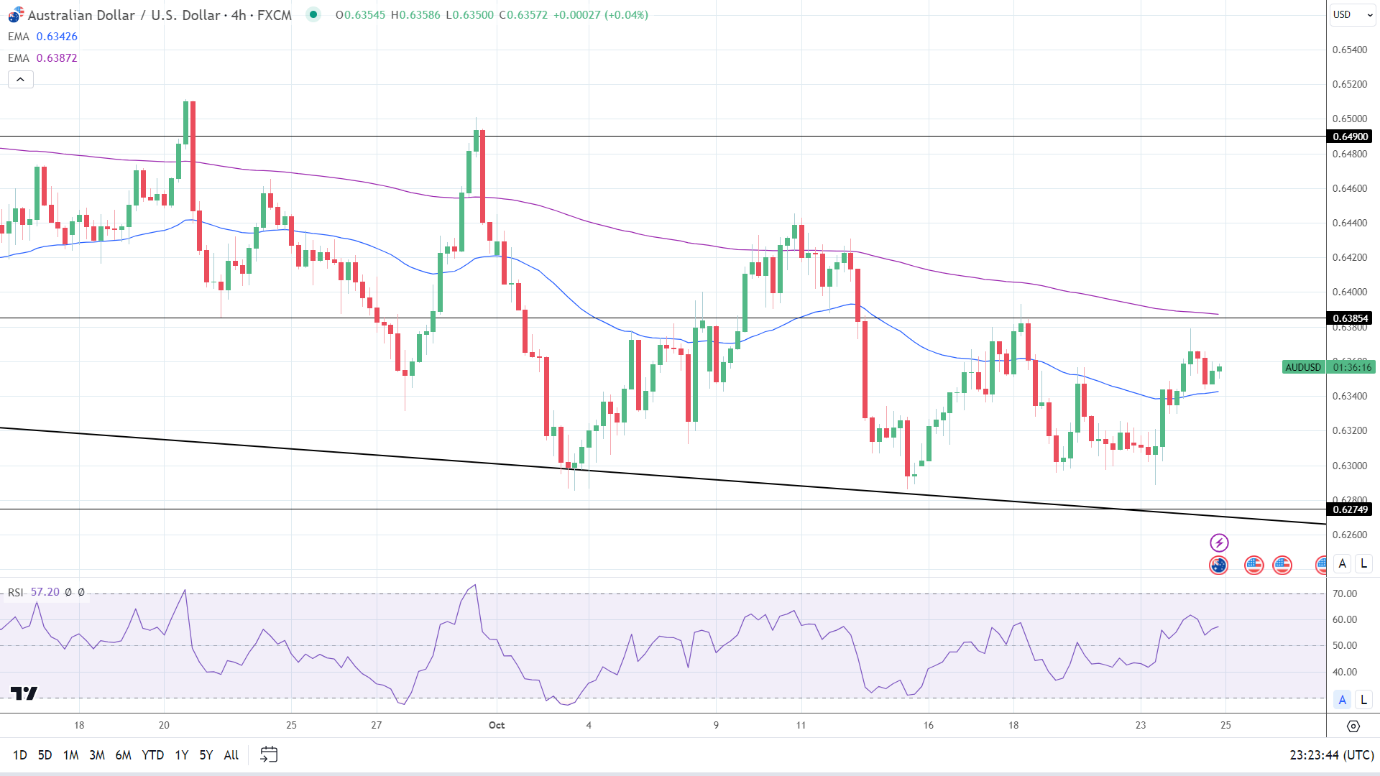
4-Hourly Chart
The AUD/USD hovers above the 50-day EMA while remaining below the 200-day EMA, sending bullish near-term but bearish longer-term price signals.
A move through the $0.63854 resistance level and 200-day EMA would support a return to $0.64. However, selling pressure may intensify at $0.63850. The 200-day EMA is confluent with the resistance level.
An AUD/USD fall through the 50-day EMA would bring the $0.62749 support level and trend line into view.
The 14-period 4-Hourly RSI at 57.20 suggests an AUD/USD move to the $0.63854 resistance level before entering overbought territory.
About the Author
Bob Masonauthor
With over 20 years of experience in the finance industry, Bob has been managing regional teams across Europe and Asia and focusing on analytics across both corporate and financial institutions. Currently he is covering developments relating to the financial markets, including currencies, commodities, alternative asset classes, and global equities.
Did you find this article useful?
Latest news and analysis


Advertisement