
Advertisement
Advertisement
AUD to USD Forecast: Middle East Conflict Casts Shadow on Aussie Dollar
By:
In the short term, AUD/USD movements will respond to news updates from the Middle East, PMIs, and inflation data impacting RBA and Fed decisions.

In this article:
Highlights
- AUD/USD declined by 0.30% on Friday, following a 0.12% loss the day before.
- Geopolitical tensions in the Middle East persist, with recent clashes and missile strikes.
- The Chicago Fed National Activity Index (CFNAI) and upcoming inflation data will impact Fed rate hike prospects.
Friday Overview
On Friday, the AUD/USD declined by 0.30%. Following a 0.12% loss on Thursday, the Aussie dollar ended the day at $0.63097. The Aussie dollar rose to a high of $0.63288 before falling to a low of $0.62972.
Inflation, the RBA, and the Middle East Conflict
Last Thursday, employment figures from Australia dampened expectations of an RBA rate hike. However, inflation figures on Wednesday could corner the RBA into a move. Hotter-than-expected inflation numbers may lead to an RBA rate hike on November 7.
Higher interest rates raise borrowing costs, impacting disposable income and consumer spending. A pullback in consumer spending eases demand-driven inflationary pressures.
Beyond the inflation figures, the Middle East conflict will remain a focal point. Concerns about an escalation may continue to cap the upside for the AUD/USD. The RBA and other central banks will likely consider the risks of a regional conflict on inflation and the economy.
Higher oil prices could pressure central banks to hike rates to counter the likely impact on consumer prices. Certain economies, including the Australian economy, may suffer from further price pressures and rate hikes.
There are no Australian economic indicators for investors to consider on Monday. The lack of indicators will leave the Middle East conflict in focus. An increase in geopolitical tensions would fuel a flight to the safety of the US dollar.
Chicago Fed National Activity Index and the Fed in Focus
Last Thursday, Fed Chair Powell solidified market expectations of the Fed keeping interest rates unchanged in November.
According to the CME FedWatch Tool, there was a 0% chance of a Fed 25 basis point rate hike in November. However, there is a lingering chance of a December rate hike (22.3%). Tight labor market conditions and consumer spending have supported a sticky inflation environment.
A spike in US Treasury yields may have eased pressure on the Fed to push rates higher. However, solid US economic indicators and inflation numbers on Friday could change the narrative.
On Monday, the Chicago Fed National Activity Index (CFNAI) will give investors a view of the US economy. The CFNAI considers 85 monthly economic indicators. A return to positive territory would ease fears of a US hard landing and raise the threat of a Fed rate hike.
Economists forecast the CFNAI to increase from -0.16 to 0.05 in September. Beyond the headline figure, investors must consider components, including personal consumption and employment.
Short-Term Forecast
Near-term AUD/USD trends will likely hinge on news updates from the Middle East. However, private sector PMIs on Tuesday need consideration. This week, Australian and US inflation figures will also impact sentiment toward RBA and Fed monetary policy goals.
AUD/USD Price Action
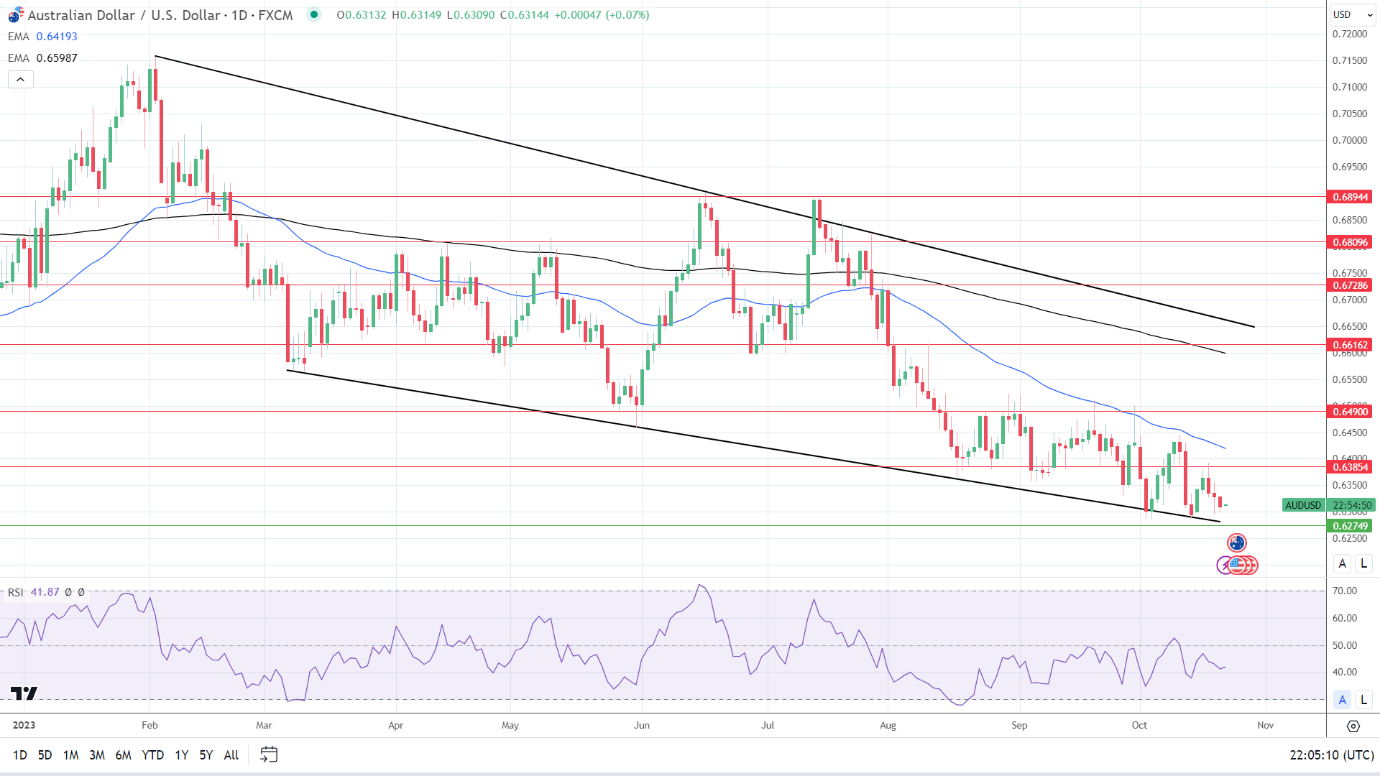
Daily Chart
The AUD/USD sat below the 50-day and 200-day EMAs, sending bearish price signals.
A return to sub-$0.63 would bring the trend line and $0.62749 support level into play. An escalation in the Middle East conflict and a sharp increase in the CFNAI would pressure the AUD/USD.
However, a return to $0.63500 would support a break above the $0.63854 resistance level to target the 50-day EMA.
A de-escalation in the Middle East would likely deliver an Aussie dollar relief rally.
A 14-period Daily RSI reading of 41.87 indicates an AUD/USD break below the trend line and $0.62749 support level before entering oversold territory (typically below 30 on the RSI scale).
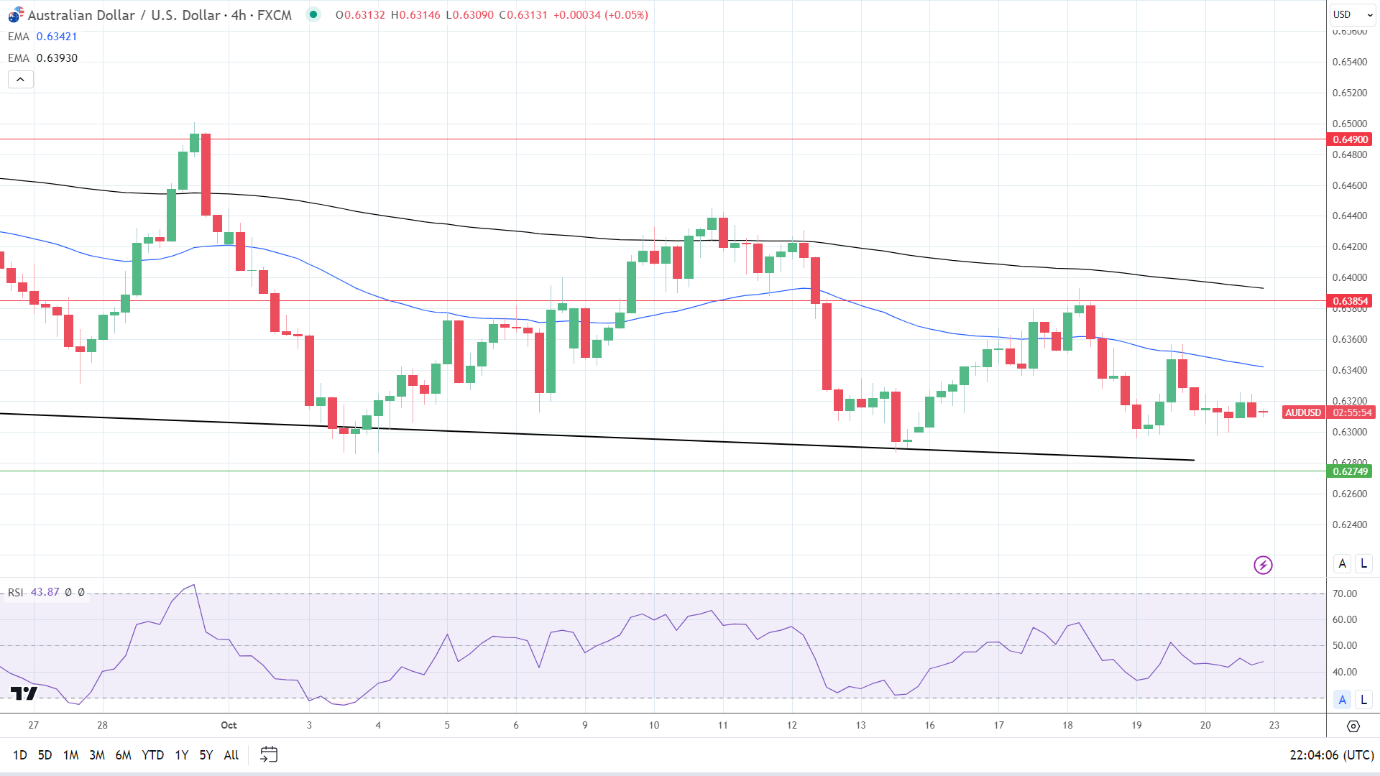
4-Hourly Chart
The AUD/USD hovers below the 50-day and 200-day EMAs, reaffirming bearish price signals.
A break above the 50-day EMA would support a move to the $0.63854 resistance level and 200-day EMA.
However, a drop below the $0.63 handle would give the bears a run at the trend line and the $0.62749 support level.
The 14-period 4-Hourly RSI at 43.87 suggests an AUD/USD fall through the trend line and support level before entering oversold territory.
About the Author
Bob Masonauthor
With over 20 years of experience in the finance industry, Bob has been managing regional teams across Europe and Asia and focusing on analytics across both corporate and financial institutions. Currently he is covering developments relating to the financial markets, including currencies, commodities, alternative asset classes, and global equities.
Did you find this article useful?
Latest news and analysis


Advertisement