
Advertisement
Advertisement
AUD to USD Forecast: Aussie Dollar’s Fate Tied to China’s Economic Pulse
By:
Amidst global economic shifts, the Aussie dollar's trajectory is closely linked to China's market indicators.

In this article:
Highlights
- The Aussie dollar rebounded on Thursday after a slight dip the previous day.
- China’s economic indicators will heavily influence the AUD/USD market sentiment.
- Positive US economic signals would hint at a potentially stronger USD over the near term.
Thursday Overview
On Thursday, the AUD/USD gained 0.28%. Following a 0.07% slip on Wednesday, the Aussie dollar ended the session at $0.64392. The Aussie dollar fell to a low of $0.64139 before rising to a high of $0.64597.
Chinese Economy to Take Center Stage
Industrial production, fixed asset investment, retail sales, and unemployment figures from China will influence market risk sentiment. The numbers are expected to show an economy that’s stabilizing, which could support riskier assets.
Economists forecast retail sales and industrial production to increase by 3.0% and 4.0% year-over-year, respectively. While expecting the unemployment rate to hold steady at 5.3%, economists expect fixed asset investments to slow from 3.4% to 3.3% year-over-year.
Figures that are in line with or better than expected for industrial production, retail sales, and unemployment would offer support to AUD/USD.
The Chinese economy significantly influences Australia, with China receiving one-third of Australia’s exports. Given Australia’s trade-to-GDP ratio of 50%, weak demand from China impacts the AUD/USD, Australia’s economy, and its labor market, where 20% of jobs are trade-related.
Manufacturing Sector to Play Second Fiddle to Consumer Sentiment
Industrial production and NY Empire State Manufacturing Index numbers will be in focus today. However, with the manufacturing sector accounting for less than 20% of the US economy, we expect consumer sentiment figures to garner more interest.
The preliminary September Michigan Consumer Sentiment and Expectation figures will draw investor interest. However, investors should look beyond the headline figures, with inflation and labor market conditions likely focal points.
Economists forecast the Michigan Consumer Sentiment Index to fall from 69.5 to 69.1 in September.
Short-Term Forecast
Economic indicators from China need to be positive to further support the Aussie dollar and alleviate concerns regarding the economic outlook. While the RBA is looking to avoid a recession, the US economy continues to send positive signals, which should favor a stronger US dollar.
AUD/USD Price Action
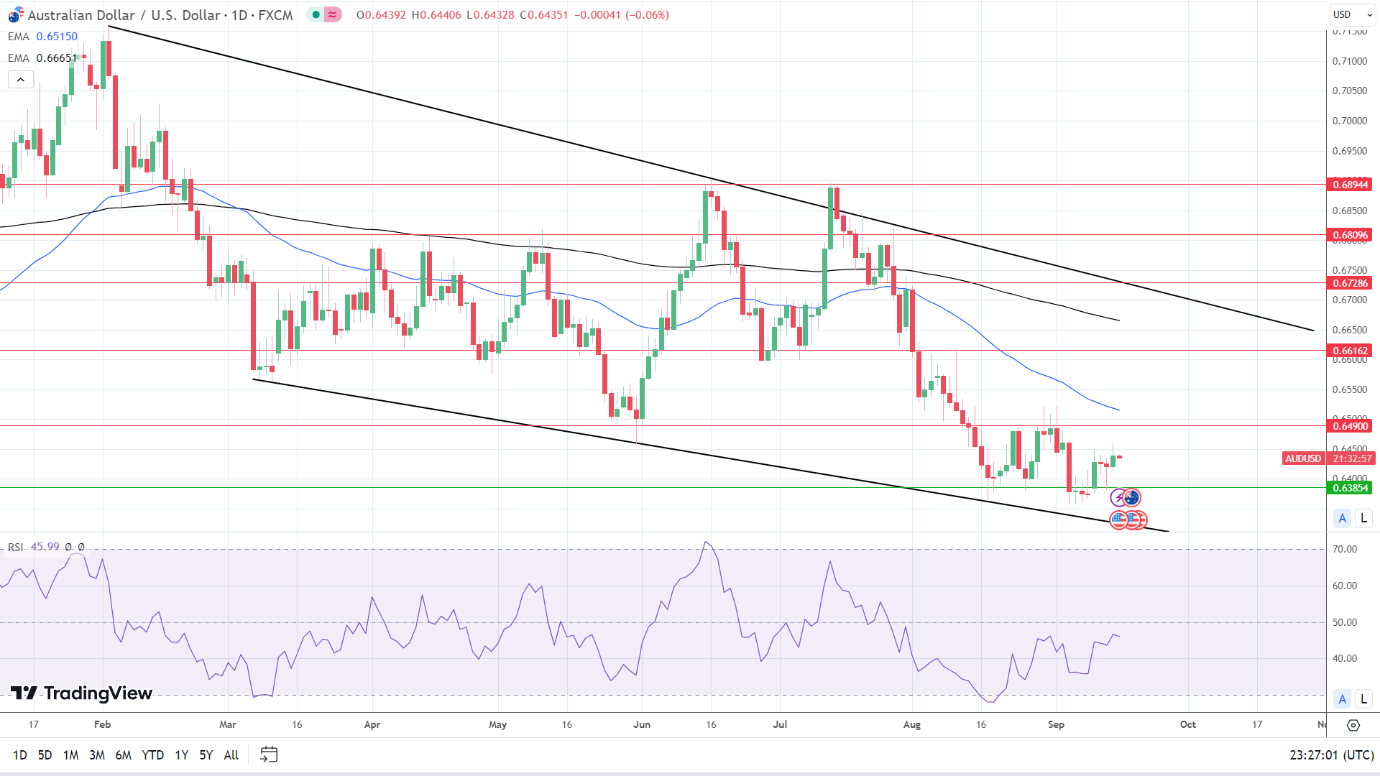
Daily Chart
The AUD/USD remained above the $0.63854 support level and trend line. However, the 50-day and 200-day EMAs reaffirmed bearish price signals. Weak economic indicators from China would support an AUD/USD move toward the $0.63854 support level.
However, investors should consider the Michigan Consumer Sentiment figures out later in the session. An unexpected pickup in consumer sentiment would signal an upbeat spending outlook and support a break below the $0.63854 support level to target the trend line.
The RSI reading of 45.99 indicates the AUD/USD can fall to sub-$0.64 before entering oversold territory.
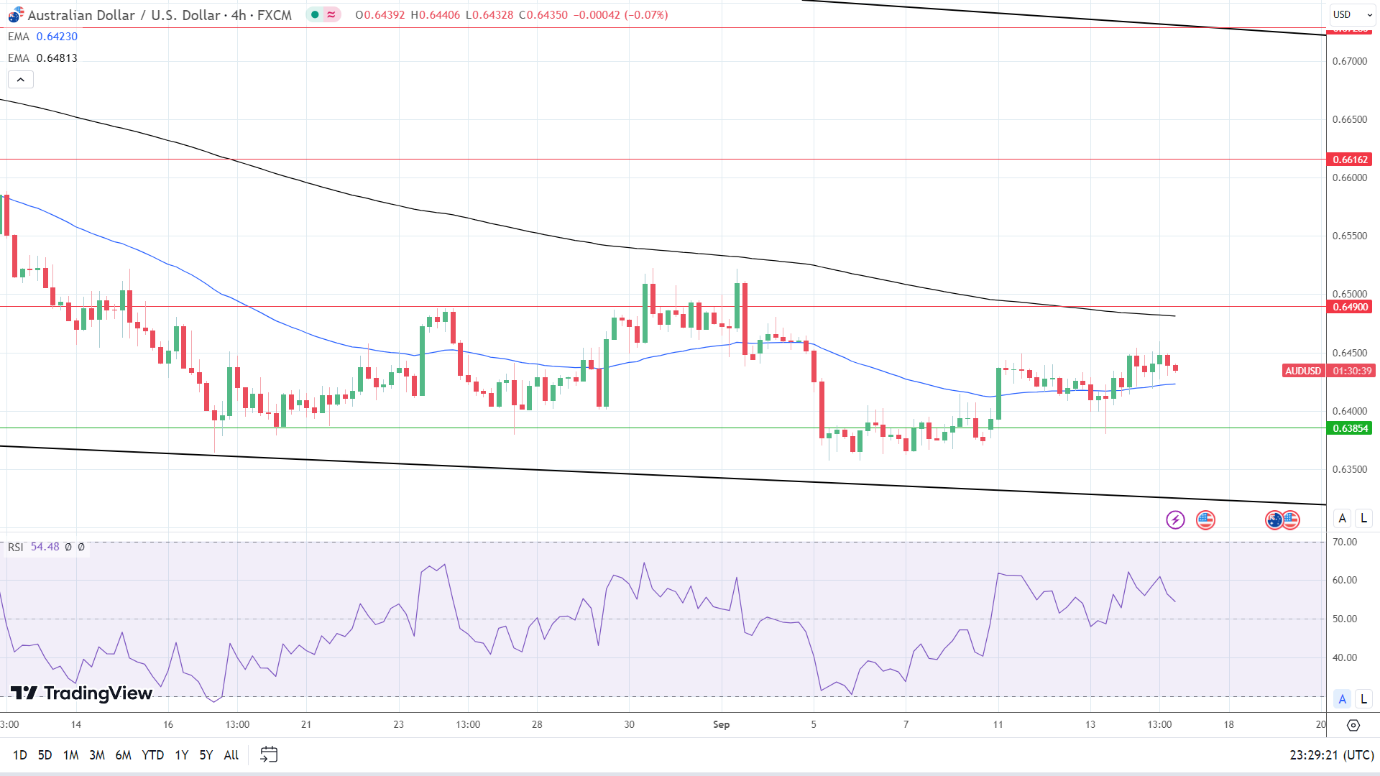
4-Hourly Chart
The AUD/USD hovers above the 50-day EMA, signaling short-term bullishness, but sits below the 200-day EMA, indicating long-term bearishness.
An AUD/USD hold above the 50-day EMA would support a move toward the 200-day EMA and the $0.64900 resistance level into play.
A break below the 50-day EMA would signal an AUD/USD move toward the $0.63854 support level. However, the bears would need disappointing numbers from China for a fall to sub-$0.64 levels.
Considering the RSI at 54.48, the Aussie dollar can return to $0.6450 before entering overbought territory.
About the Author
Bob Masonauthor
With over 20 years of experience in the finance industry, Bob has been managing regional teams across Europe and Asia and focusing on analytics across both corporate and financial institutions. Currently he is covering developments relating to the financial markets, including currencies, commodities, alternative asset classes, and global equities.
Did you find this article useful?
Latest news and analysis


Advertisement