- GBP/JPY pair trades nearly flat at 185.58 as risk aversion strengthens the USD/JPY pair, indirectly softening the Yen against most G8 currencies.
- Technical analysis shows the pair with an upward bias, facing next resistance at the August 30 high of 186.06 and a year-to-date high at 186.76.
- Short-term hourly chart suggests a sideways but slightly upward tilt, with crucial support and resistance levels identified at 185.17 and 186.19, respectively.
The Pound Sterling (GBP) gained ground against the Japanese Yen (JPY) amid risk aversion, which triggered flows toward the safe-haven status of the Greenback (USD). Hence, strength in the USD/JPY pair weighed on the JPY, which remained soft against most G8 currencies. The GBP/JPY exchanges hands at 185.58, almost flat as the Asian session begins.
GBP/JPY Price Analysis: Technical outlook
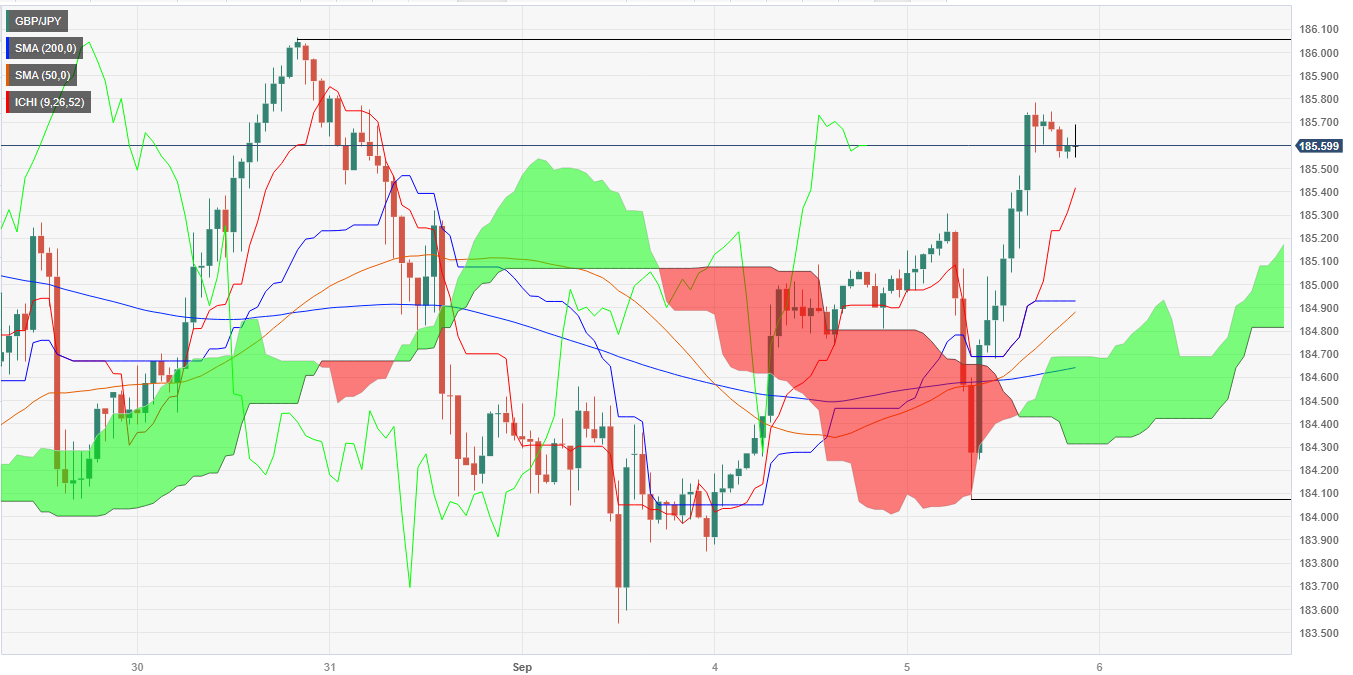
The daily chart portrays the pair as upward biased, though it still needs to clear the next resistance seen at the August 30 high at 186.06. An upside break would expose the year-to-date (YTD) high of 186.76 before the GBP/JPY tests 187.00. Conversely, downside risks emerge at the Tenkan-Sen line at 184.70, followed by the Senkou Span at 184.14. Once that area is cleared, the pair’s next stop would be the Kijun-Sen line at 183.58.
In the short term, the GBP/JPY hourly chart portrays the pair as sideways, though slightly tilted upwards. If the pair breaks the August 30 high of 186.06, the R1 daily pivot would be the next resistance at 186.19. A breach of the latter would expose the YTD high at 186.76, shy of the R2 pivot point at 186.84. On the downside, the first support would be the confluence of the daily pivot and the Senkou Span A at 185.17, followed by the psychological 185.00 figure.
GBP/JPY Price Action – Hourly chart
Information on these pages contains forward-looking statements that involve risks and uncertainties. Markets and instruments profiled on this page are for informational purposes only and should not in any way come across as a recommendation to buy or sell in these assets. You should do your own thorough research before making any investment decisions. FXStreet does not in any way guarantee that this information is free from mistakes, errors, or material misstatements. It also does not guarantee that this information is of a timely nature. Investing in Open Markets involves a great deal of risk, including the loss of all or a portion of your investment, as well as emotional distress. All risks, losses and costs associated with investing, including total loss of principal, are your responsibility. The views and opinions expressed in this article are those of the authors and do not necessarily reflect the official policy or position of FXStreet nor its advertisers. The author will not be held responsible for information that is found at the end of links posted on this page.
If not otherwise explicitly mentioned in the body of the article, at the time of writing, the author has no position in any stock mentioned in this article and no business relationship with any company mentioned. The author has not received compensation for writing this article, other than from FXStreet.
FXStreet and the author do not provide personalized recommendations. The author makes no representations as to the accuracy, completeness, or suitability of this information. FXStreet and the author will not be liable for any errors, omissions or any losses, injuries or damages arising from this information and its display or use. Errors and omissions excepted.
The author and FXStreet are not registered investment advisors and nothing in this article is intended to be investment advice.
Recommended content
Editors’ Picks
AUD/USD: Bears could not breach 0.6600

After a brief drop to the sub-0.6600 region, AUD/USD gathered traction and eventually ended Thursday’s session with marked gains in response to the renewed selling pressure hurting the Greenback.
EUR/USD: The 200-day SMA holds the downside… for now

EUR/USD reversed two consecutive daily pullback and regained some lost shine, all after putting the key 200-day SMA near 1.0790 to the test, ahead of the release of EMU CPI and US PCE on Friday.
Gold in a consolidative phase ahead of PCE inflation

Gold gained traction and recovered toward $2,350 in the American session on Thursday. The benchmark 10-year US Treasury bond yield is down more than 1% on the day following the downward revision to US GDP data, fuelling XAU/USD's rebound.
Ethereum maintains horizontal trend following BlackRock's updated S-1 filing

Ethereum (ETH) price shows neutrality despite positive updates of BlackRock's spot ETH ETF updated S-1 application and the Securities & Exchange Commission’s (SEC) engagement with issuers.
OPEC+ meeting could switch oil regime

Oil declined for the second day in a row, reversing down from its 200-day moving average for the third time this month. An OPEC+ meeting is scheduled for this weekend with enough potential to break the tie.