
Advertisement
Advertisement
EUR/USD, GBP/USD, USD/CAD, USD/JPY Forecasts – Euro Retreats After Inflation Data
By:
U.S. dollar gained solid upside momentum despite the pullback in Treasury yields.

In this article:
Key Insights
- U.S. Dollar Index rebounds from recent lows as traders react to the economic reports.
- EUR/USD moved lower as Euro Area Core Inflation Rate declined to 5.3% in August.
- USD/JPY moved towards the 145.50 level as traders focused on the pullback in Treasury yields.
U.S. Dollar
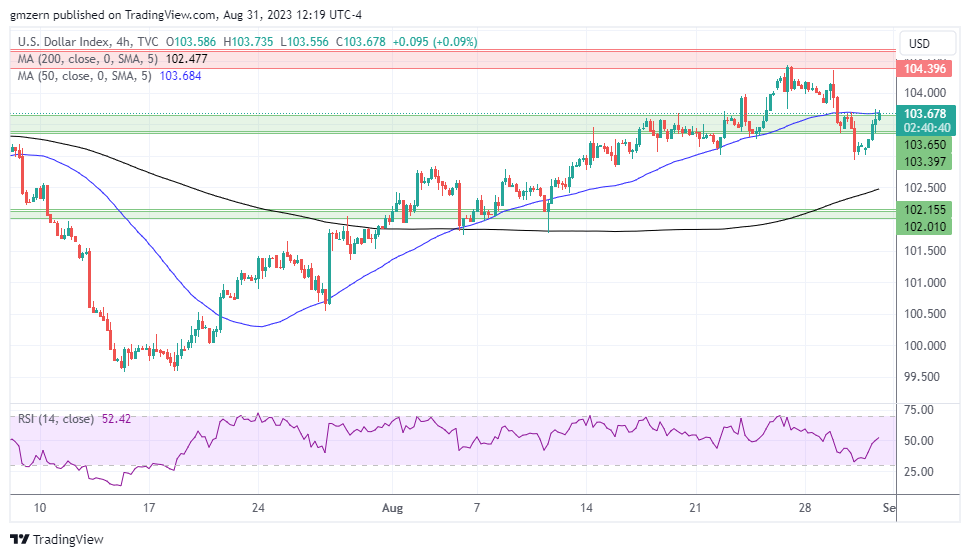
U.S. Dollar Index is moving higher despite the pullback in Treasury yields. Today, traders focused on the economic reports. Initial Jobless Claims report showed that 228,000 Americans filed for unemployment benefits in a week. PCE Price Index increased from 3% in June to 3.3% in July. Personal Income grew by 0.2% month-over-month in July, while Personal Spending increased by 0.8%.
In case U.S. Dollar Index stays above the support at 103.65, it will head towards the nearest resistance level at 104.40 – 104.70.
EUR/USD
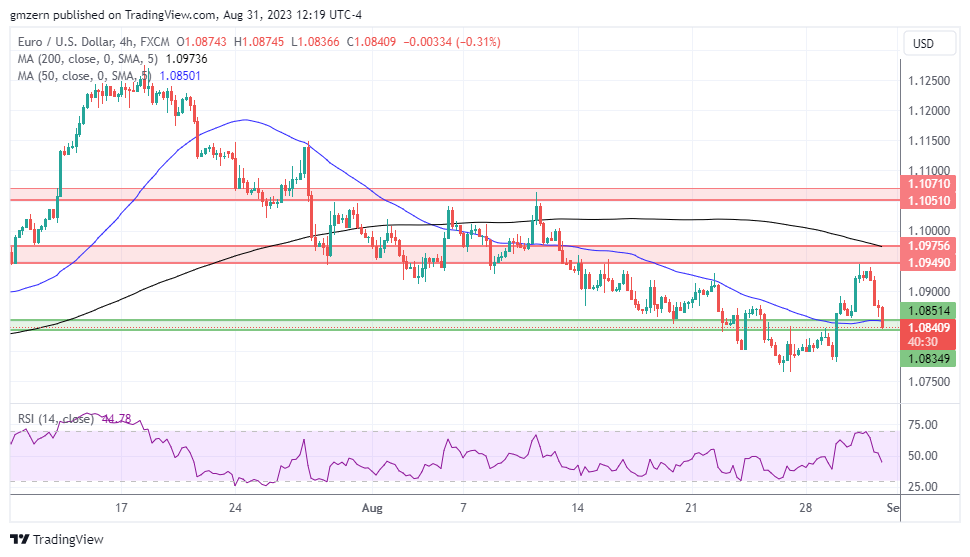
EUR/USD pulled back as traders reacted to the Euro Area inflation reports. Inflation Rate remained unchanged at 5.3% in August, while Core Inflation Rate declined from 5.5% in July to 5.3% in August.
RSI remains in the moderate territory, so EUR/USD will have a good chance to gain additional downside momentum in case it manages to settle below the 1.0835 level.
GBP/USD
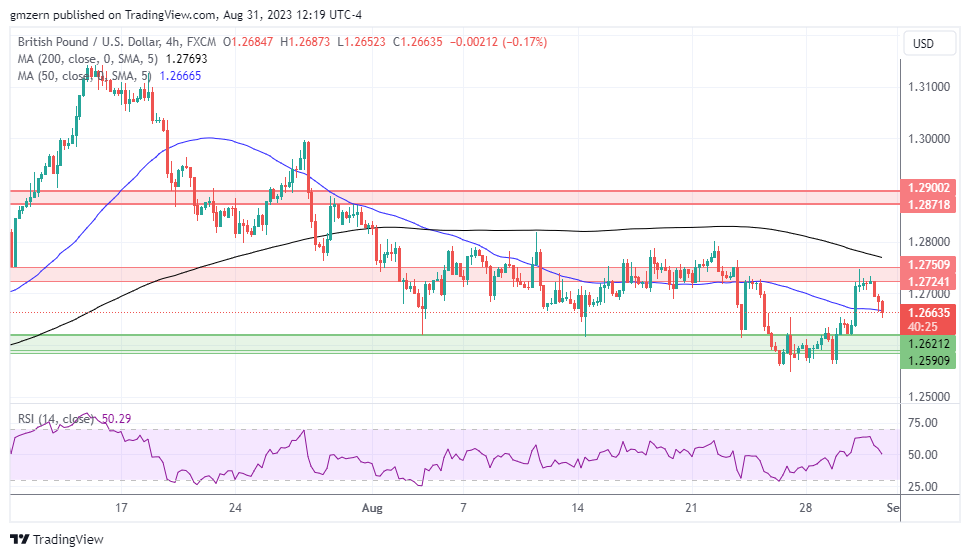
GBP/USD faced resistance near the 1.2725 level and pulled back as traders focused on the general strength of the American currency.
If GBP/USD settles below the 50 MA at 1.2665, it will head towards the next support level, which is located at 1.2590 – 1.2620.
USD/CAD
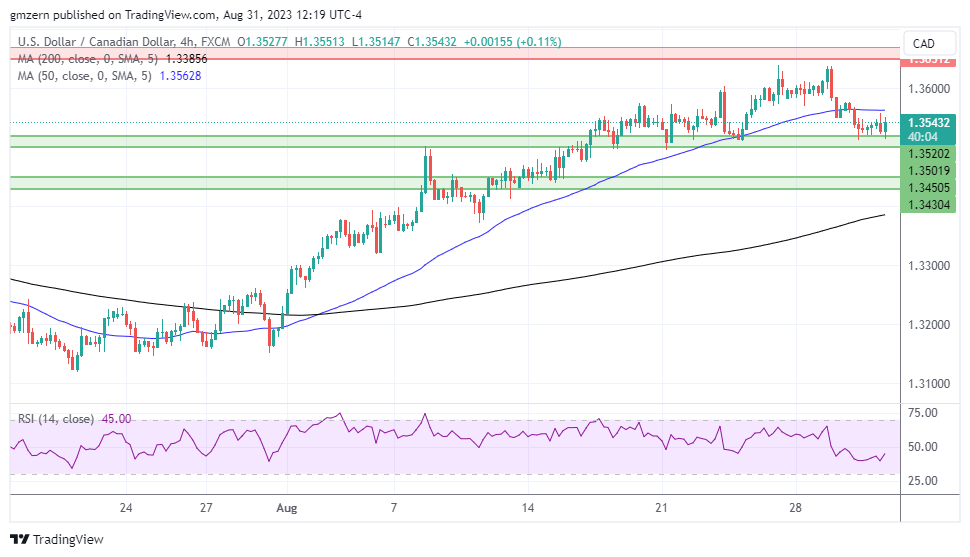
USD/CAD gains ground despite rising oil markets due to the general strength of the U.S. dollar.
From the technical point of view, USD/CAD found support near the 1.3520 level and will try to gain additional upside momentum.
USD/JPY
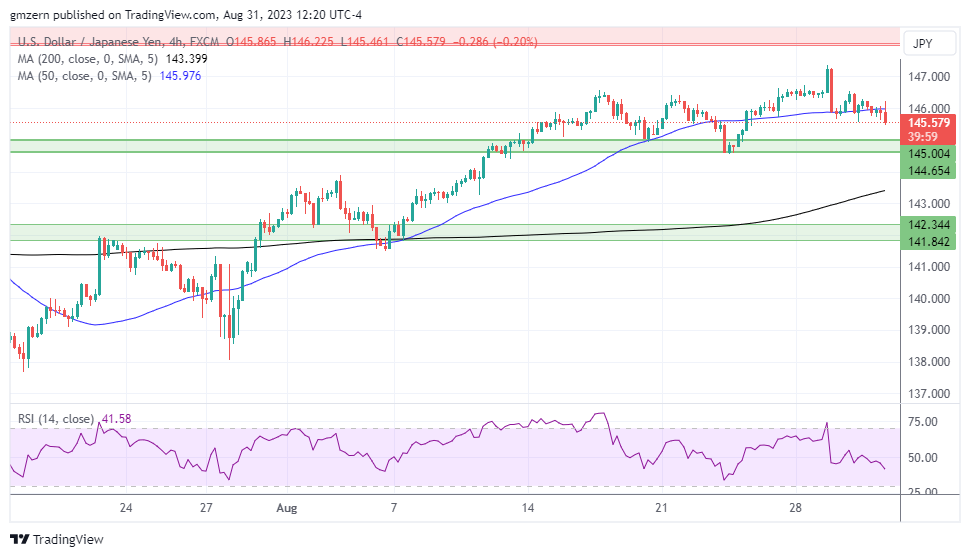
USD/JPY is losing ground as Treasury yields continue to move away from their recent highs.
The nearest support level for USD/JPY is located in the 144.65 – 145.00 range. A successful test of this level will open the way to the test of the next support at 141.85 – 142.35.
For a look at all of today’s economic events, check out our economic calendar.
About the Author
Vladimir Zernovauthor
Vladimir is an independent trader and analyst with over 10 years of experience in the financial markets. He is a specialist in stocks, futures, Forex, indices, and commodities areas using long-term positional trading and swing trading.
Did you find this article useful?
Latest news and analysis


Advertisement