
Advertisement
Advertisement
AUD to USD Forecast: Aussie Dollar’s Fate Tied to Inflation and Fed Interest Rate Bets
By:
After a gain on Monday, the Australian Dollar sees a potential influence from inflation figures, housing sector numbers, and US ADP nonfarm employment change.

In this article:
Highlights
- The AUD/USD rallied 0.80% on Tuesday, ending the day at $0.64802 after a low of $0.64010 and a high of $0.64868.
- The Consumer Price Index (CPI) in July holds the key to RBA’s monetary stance in September.
- July’s retail sales figures defied estimates, stirring up RBA considerations alongside rising inflation.
Tuesday Overview
The AUD/USD rallied 0.80% on Tuesday. Following a 0.43% gain on Monday, the Aussie Dollar ended the day at $0.64802. The Australian Dollar fell to a low of $0.64010 before striking a high of $0.64868.
Australian CPI to Define the RBA September Gathering
Housing sector numbers will draw interest this morning. Following aggressive RBA monetary policy moves to tame inflation, the housing sector could materially impact consumer sentiment and consumption.
Construction work done and building permit numbers will give investors a view of real estate market conditions in an elevated interest rate environment.
While the numbers will influence, inflation figures will have more impact on the Aussie Dollar. The monthly CPI indicator for July will influence sentiment toward the September RBA monetary policy decision. Hotter-than-expected inflation figures could pressure the RBA into another rate hike.
Economists forecast an annual inflation rate of 5.2% versus 5.4% in June. Significantly, a pickup in inflationary pressures would coincide with the July retail sales figures that beat estimates. According to preliminary numbers, retail sales rose by 0.5% in July versus a 0.8% slump in June.
An increase in consumer spending and an upward trend in consumer prices are a hawkish combination for the RBA. While employment numbers gave the RBA reason to pause, a pickup in inflationary pressure would have a more material influence.
ADP Nonfarm and Q2 GDP Numbers in Focus
After the disappointing consumer sentiment and job opening numbers, the focus turns to the ADP nonfarm and second estimate GDP numbers.
While revisions to the second quarter GDP numbers will influence, we expect the ADP nonfarm employment change to have more impact. Bets on further Fed interest rate hikes eased on Tuesday. An unexpected surge in employment change could refuel hawkish Fed bets.
Economists forecast a 195k increase in employment in August versus a 324k jump in July.
Other economic indicators include real estate and trade data. We expect these reports to play second fiddle to the ADP numbers.
Beyond the economic indicators, investors should monitor FOMC chatter. Dovish commentary would fuel bets on an earlier Fed interest rate cut.
Immediate Forecast: Aussie Dollar Prospects
Monetary policy divergence narrowed sharply on Tuesday. Hotter-than-expected Australian inflation numbers and weak ADP employment change figures would yield another dollar sell-off. However, US inflation numbers and the US Jobs Report will have the final say.
AUD/USD Price Action
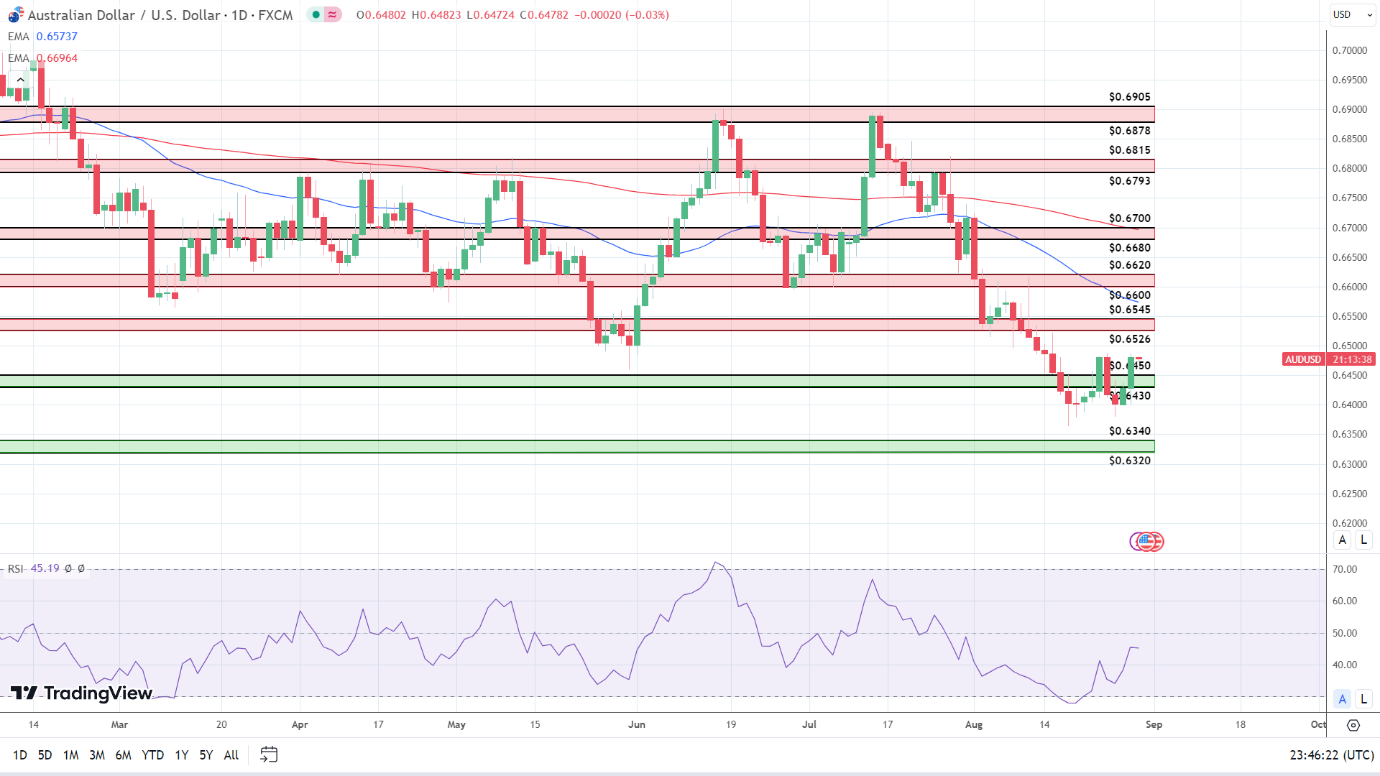
Daily Chart
On Tuesday, the AUD/USD broke through the $0.6430 – $0.6450 resistance band. We expect further price action today. After the overnight US economic indicators, Australian inflation numbers could give the Aussie Dollar a run at the $0.6526 – $0.6545 resistance band. A return to $0.65 would also bring the day EMA into play.
However, despite the Tuesday breakout, the EMAs and RSI signal a possible return to sub-$0.6450. Considering the 14-Daily RSI at 45.19, the Aussie dollar has room to fall before hitting oversold territory. With Australian inflation numbers in focus this morning, weaker-than-expected numbers would bring the $0.6430 – $0.6450 support band into play.
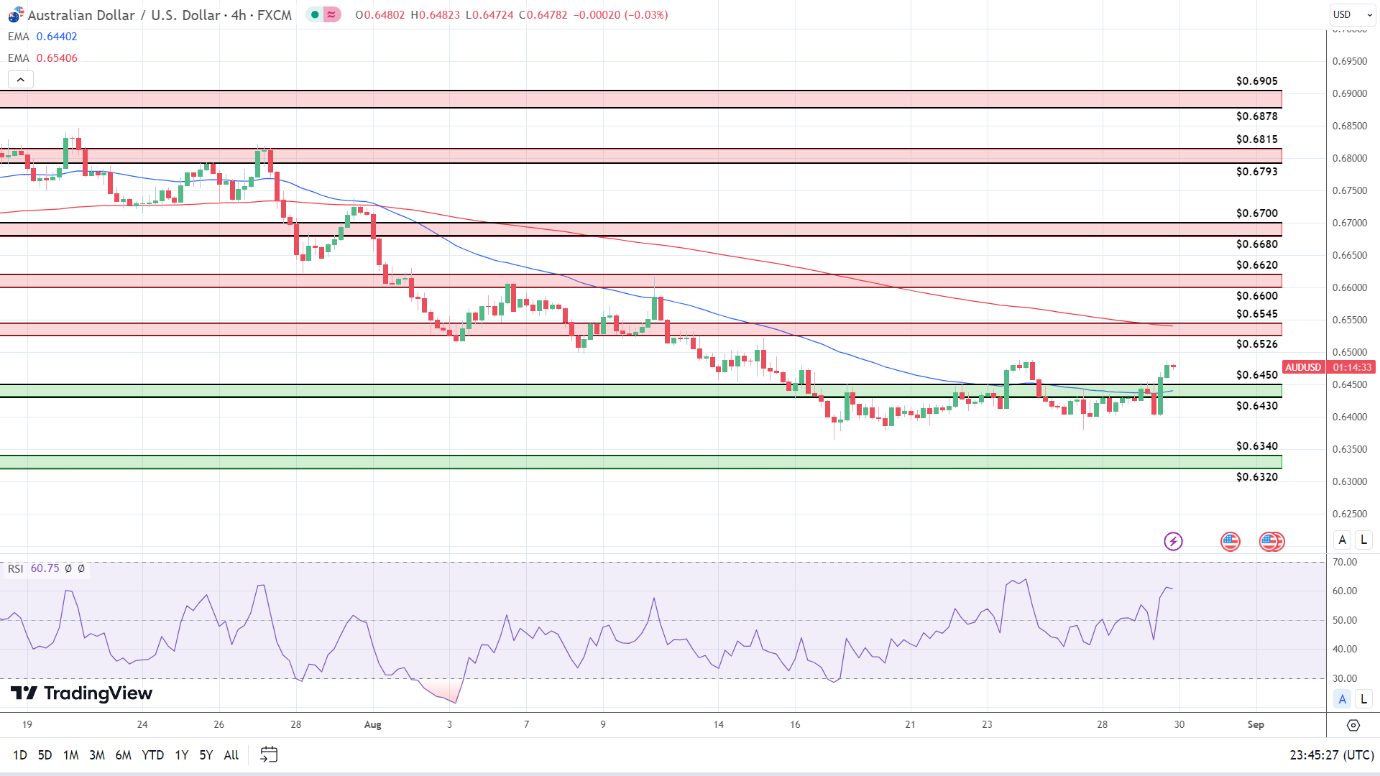
4-Hourly Chart
The 4-Hourly Chart signaled a shift in investor sentiment. After the breakout from the 50-day EMA on Tuesday, Australian CPI numbers and US ADP employment change figures need to support a return to $0.65 to bring the $0.6526 – $0.6545 resistance band and the 200-day EMA into play.
However, weak Australian CPI numbers and a surge in US employment would give the bears a run at the $0.6450 – $0.6430 support band and the 200-day EMA.
Considering the RSI at 60.75 and the breakout from the 50-day EMA, the Aussie dollar has more room to run before hitting overbought territory.
About the Author
Bob Masonauthor
With over 20 years of experience in the finance industry, Bob has been managing regional teams across Europe and Asia and focusing on analytics across both corporate and financial institutions. Currently he is covering developments relating to the financial markets, including currencies, commodities, alternative asset classes, and global equities.
Did you find this article useful?
Latest news and analysis


Advertisement