
Advertisement
Advertisement
USD/JPY Forecast: A Tug of War Between Powell’s Words and Japanese Yen Inflation Data
By:
Amid fluctuating price points, USD/JPY traders await Powell's speech, weighing Tokyo inflation news against US economic indicators.

In this article:
Highlights
- USD/JPY’s breakout session, fueled by anticipation of Fed Chair Powell’s speech, ending Thursday at 145.824.
- Tokyo’s August inflation figures spark renewed interest, with annual core inflation softening to 2.8%.
- Powell’s stance to dictate the interest rate trajectory.
Thursday Overview
On Thursday, the USD/JPY rallied by 0.68% to end the session at 145.824. A breakout session saw the USD/JPY rally from an early low of 145.598 to a high of 145.959 before easing back. Fear of a hawkish Fed Chair Powell speech reversed the losses from Wednesday.
Tokyo Inflation Numbers Deliver More BoJ Policy Uncertainty
This morning, Tokyo inflation numbers for August drew interest. The July national inflation figures gave no reason for the Bank of Japan to shift from its ultra-loose monetary policy stance.
However, the Tokyo annual core inflation rate softened from 3.0% to 2.8% in August. Economists forecast core inflation to ease to 2.9%. The annual inflation rate fell from 3.2% to 2.9%.
Considering the latest inflation numbers and the August private sector PMIs, the Bank of Japan could begin to reconsider its ultra-loose monetary policy stance.
Fed Chair Powell Will Have the Final Say
Finalized Michigan consumer sentiment figures for August will draw interest today. Revisions to preliminary figures will need consideration. According to preliminary numbers, the Michigan Consumer Sentiment Index fell from 71.6 to 71.2. Despite the Fed hiking interest rates to 5.50%, inflation expectations softened from 3.4% to 3.3%, well above the Fed target of 2.0%.
While the numbers will draw interest, Fed Chair Powell will be the focal point. Speaking minutes after the Michigan report, the Fed Chair could remove uncertainty about the interest rate outlook. Investors remain divided on whether the Fed will deliver one final rate hike before hitting the brakes.
US unemployment and the US annual inflation rate suggest further monetary policy tightening. In July, the US unemployment fell from 3.6% to 3.5%, with the annual inflation rate accelerating from 3.0% to 3.2%.
While private sector activity expanded more slowly, according to the prelim US private sector PMI numbers, investors remain anxious about the Fed Chair Powell speech. The market angst leaves the USD/JPY open to a sharp reaction to dovish or hawkish forward guidance.
Considering the latest round of US economic indicators, Fed Chair Powell could talk about one final rate hike before hitting the brakes. However, Powell could sit on the fence and leave the markets in limbo until the next round of US economic indicators that will dictate the interest rate trajectory.
USD/JPY Price Action
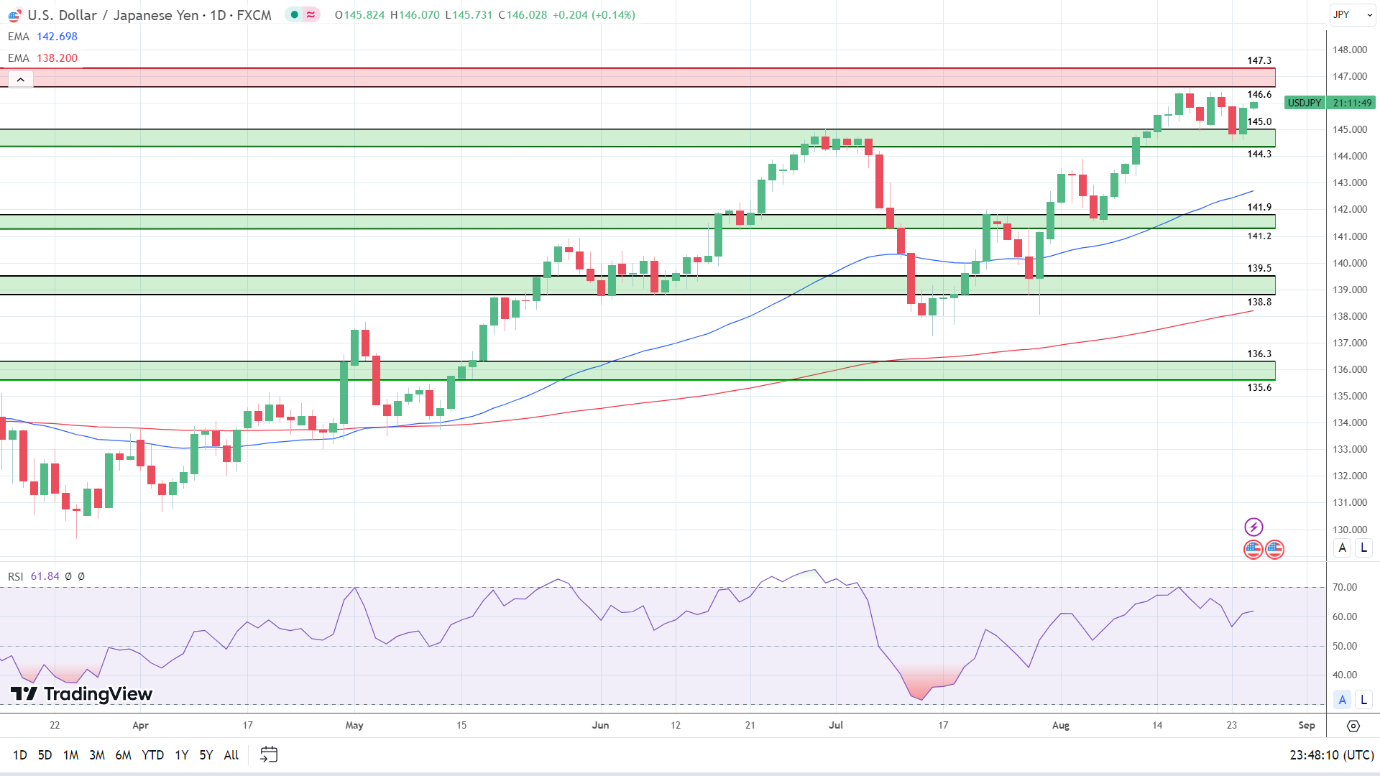
Daily Chart
The Daily Chart showed the USD/JPY below the 146.6 – 147.3 resistance band. After the breakout Thursday session, the USD/JPY held above 50-day and 200-day EMAs, sending bullish near and longer-term price signals.
Looking at the 14-Daily RSI, 61.84 reflects bullish sentiment, supporting a move through the lower level of the 146.6 – 147.3 resistance band. However, a USD/JPY fall through the upper level of the 145.0 – 144.3 support band would bring sub-144 into play.
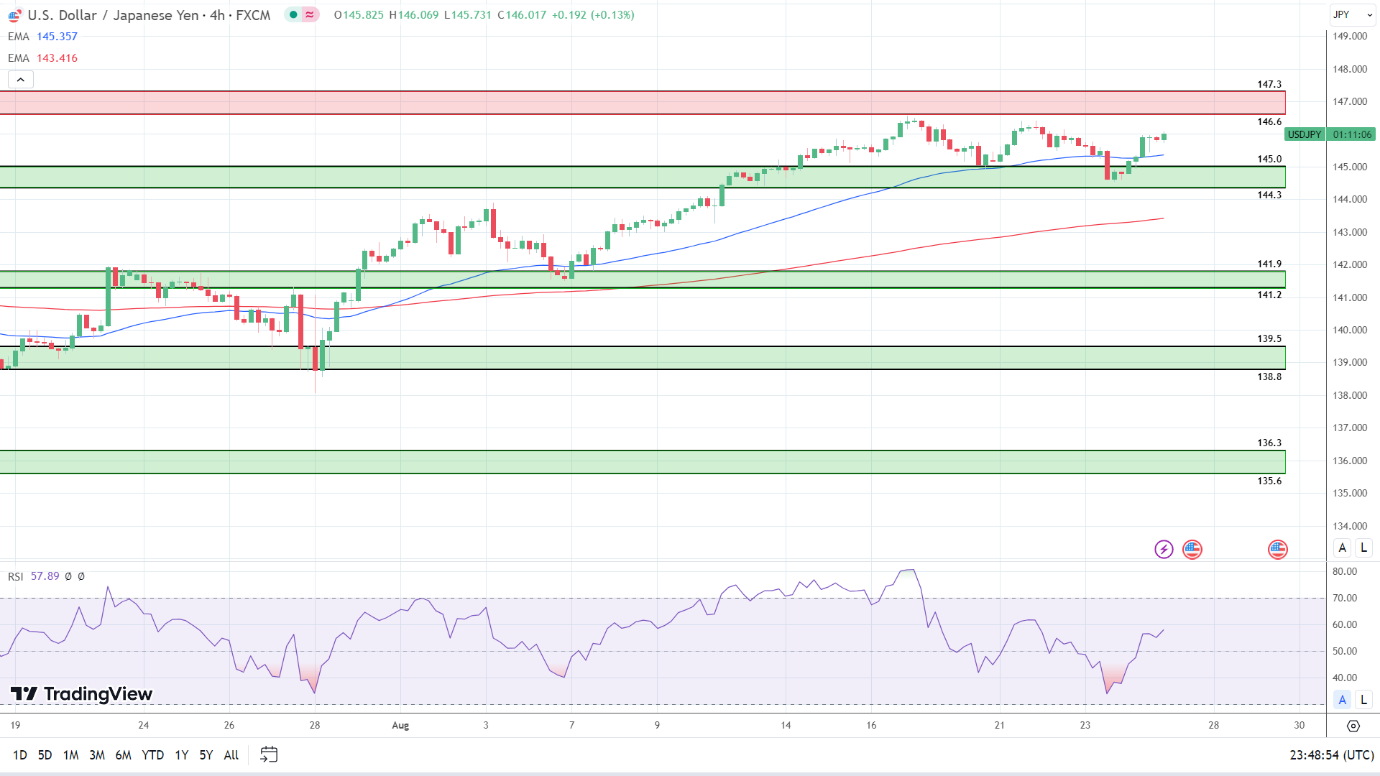
4-Hourly Chart
Looking at the 4-Hourly Chart, the USD/JPY faces resistance at 146. The USD/JPY sits below the 146.6 – 147.3 resistance band. However, the USD/JPY remains above the 50-day and 200-day EMAs, affirming the bullish near and longer-term price signals.
The 14-4H RSI reading of 57.89 reflects bullish sentiment, with buying pressure outweighing selling pressure. The RSI signals a move through the lower level of the 146.6 – 147.3 resistance band to give the bulls a run at 147. However, a fall through 50-day EMA would bring the 145.0 – 144.3 support band and sub-144 into view.
About the Author
Bob Masonauthor
With over 20 years of experience in the finance industry, Bob has been managing regional teams across Europe and Asia and focusing on analytics across both corporate and financial institutions. Currently he is covering developments relating to the financial markets, including currencies, commodities, alternative asset classes, and global equities.
Did you find this article useful?
Latest news and analysis


Advertisement