
Advertisement
Advertisement
USD/JPY Bulls to Target 144.5 on Hotter US Inflation Numbers
By:
It is a big day ahead for the USD/JPY. The US CPI Report could send monetary policy divergence sharply in favor of the greenback this afternoon.

In this article:
Highlights
- It is a big day ahead, with the heavily anticipated US CPI Report in focus.
- Hotter-than-expected inflation numbers would reignite bets on a September Fed rate hike and deliver a USD/JPY breakout.
- The near-term technical indicators are bullish, signaling a return to 144.
On Wednesday, the USD/JPY rose by 0.25% to wrap up the day at 143.716. Better-than-expected producer price index and consumer price inflation numbers from China supported riskier assets.
This morning, there are no economic indicators from Japan or China to draw interest. The lack of economic indicators will leave the USD/JPY in the hands of market risk sentiment as investors look toward the US CPI Report. With the Bank of Japan set to remain ultra-loose, monetary policy divergence could tip significantly in the dollar’s favor.
The US Session
It is a big day ahead, with the all-important US CPI Report in focus. Hotter-than-expected inflation numbers would reignite bets on a September Fed interest rate hike, which could refuel recessionary jitters.
Economists forecast the US annual inflation rate to accelerate from 3.0% to 3.3% in July and for core inflation to hold steady at 4.8%.
Jobless claims figures will also draw interest. However, we expect the numbers to play second fiddle to the CPI Report.
While the Fed considers the Core PCE Price Index numbers a leading inflation indicator, the CPI Report carries significant weight. The Fed is looking for inflationary pressures to ease significantly to take its foot off the gas. Wage growth and tight labor market conditions remain risks to the inflation puzzle.
USD/JPY Price Action
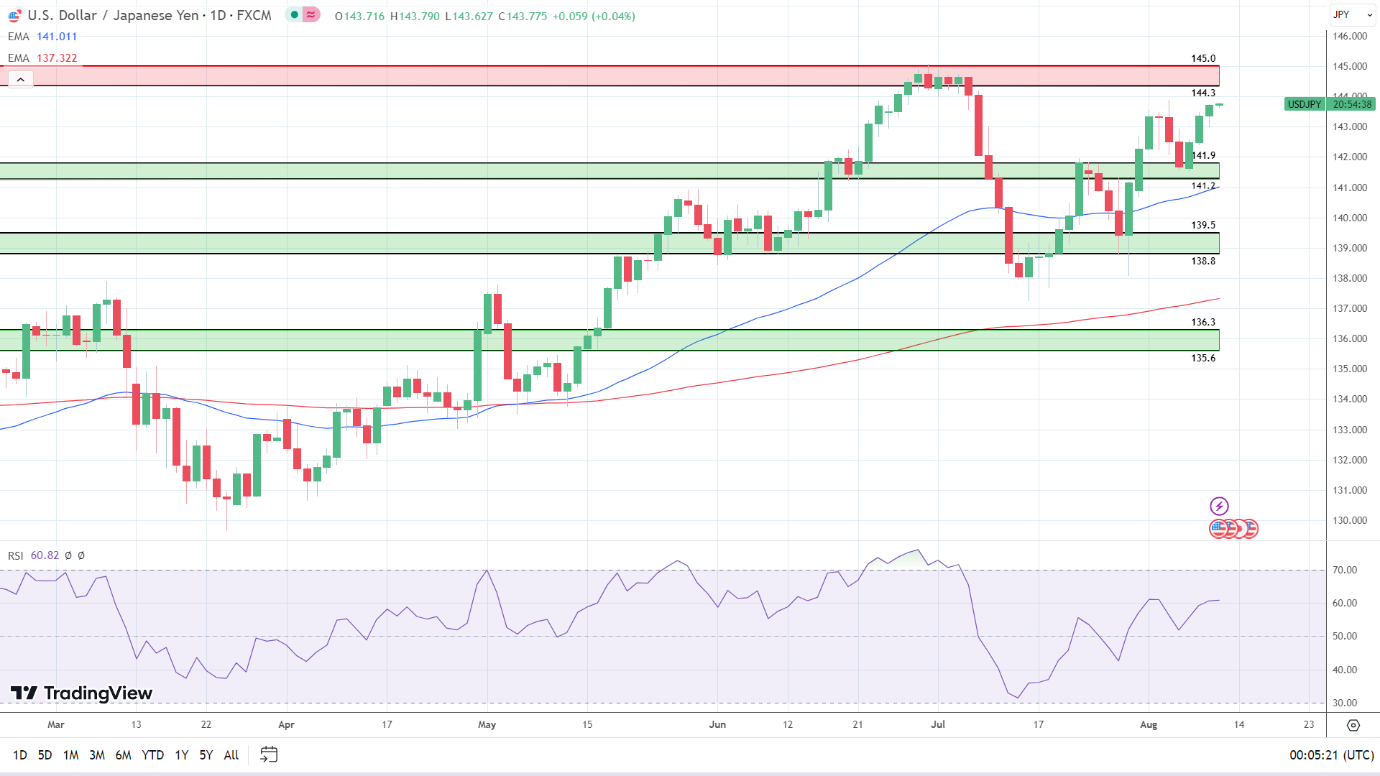
Daily Chart
The Daily Chart showed the USD/JPY above the 141.9 – 141.2 support band. After the bullish Wednesday session, the USD/JPY remained above 50-day (141.011) and 200-day (137.322) EMAs, sending bullish near and longer-term price signals.
Notably, the 50-day EMA pulled further away from the 200-day EMA, signaling further price gains.
Looking at the 14-Daily RSI, the 60.82 reading offers a bullish outlook, supporting a return to 144 and a run at the 144.3 – 145.0 resistance band. However, a USD/JPY fall through the 141.9 – 141.2 support band would bring the 50-day EMA (141.011) into play.
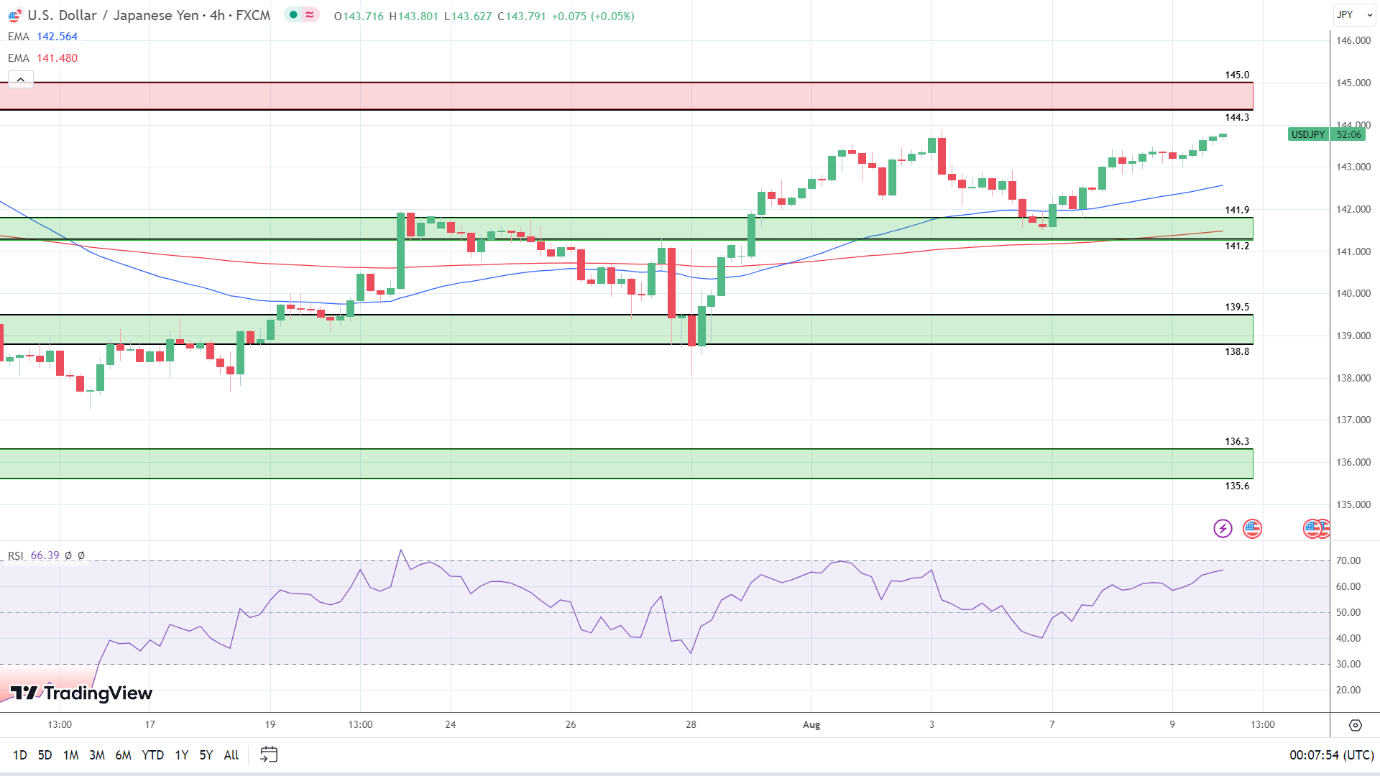
4-Hourly Chart
Looking at the 4-Hourly Chart, the USD/JPY faces strong resistance at 144. The USD/JPY sits above the 141.9 – 141.3 support band and the 50-day (142.564) and 200-day (141.480) EMAs, sending bullish near and longer-term price signals. Significantly, the 50-day EMA pulled away from the 200-day EMA, signaling further gains.
A hold above the 50-day EMA and the 141.9 – 141.2 support band would support a run at the 144.3 – 145.0 resistance band. However, a fall through the 50-day EMA (142.564) would send the USD/JPY through the 141.9 – 141.2 support band and the 200-day EMA ($141.480) to sub-141.
The 14-4H RSI reading of 66.39 sends bullish signals, with buying pressure outweighing selling pressure. Significantly, the RSI aligns with the 50-day EMA, supporting a run at the 144.3 – 145.0 resistance band.
About the Author
Bob Masonauthor
With over 20 years of experience in the finance industry, Bob has been managing regional teams across Europe and Asia and focusing on analytics across both corporate and financial institutions. Currently he is covering developments relating to the financial markets, including currencies, commodities, alternative asset classes, and global equities.
Did you find this article useful?
Latest news and analysis


Advertisement