
Advertisement
Advertisement
AUD to USD Forecast: Sub-$0.65 in Play on China PPI Numbers
By:
It will be another testy morning for the AUD to USD. After the China trade data-fueled pullback, inflation numbers from China will influence today.

In this article:
Highlights
- This morning, consumer price inflation and producer price index numbers from China will affect appetite for the Aussie dollar.
- Later in the day, Fed chatter will also need consideration ahead of the US CPI Report out on Thursday.
- The near-term technical indicators remain bearish, signaling a return to sub-$0.65.
On Tuesday, the AUD/USD fell by 0.45% to end the day at $0.65437. A larger-than-expected slide in China imports and exports sent the AUD/USD south.
This morning, there are no economic indicators from Australia to influence. However, consumer price inflation and producer price index numbers from China will impact the appetite for the Aussie dollar.
Softer consumer price inflation and a less marked decline in the producer price index should provide price support. Economists forecast consumer prices to fall by 0.5% in July year-over-year after stalling in June. However, economists expect the producer price index to fall by 4.0% year-over-year versus a 5.4% decline in June.
On Tuesday, trade data from China highlighted the weak demand environment suggesting further downward pressure on producer prices and a decline in consumer prices.
Inflation figures from China are a barometer for inflation in developed and developing economies. However, disinflation reflects weak demand as goods producers compete for fewer business opportunities. The impact of economic data on the Aussie dollar is significant. Falling prices stemming from increased competition for new business reflects a deterioration in the macroeconomic environment.
The Australian economy is dependent upon China for trade. Notably, the Australian trade – GDP ratio stood at 45.8% in 2019 before declining as global trade terms deteriorated. As an exporter of commodities, weak global demand would adversely affect the Australian trade balance, the economy, and the Aussie dollar. Importantly, trade provides circa 20% of Australian jobs, a material consideration for the RBA.
The US Session
There are no US economic indicators to move the dial this afternoon. However, investors should monitor the news wires for Fed chatter with the media ahead of the US CPI Report out on Thursday.
AUD/USD Price Action
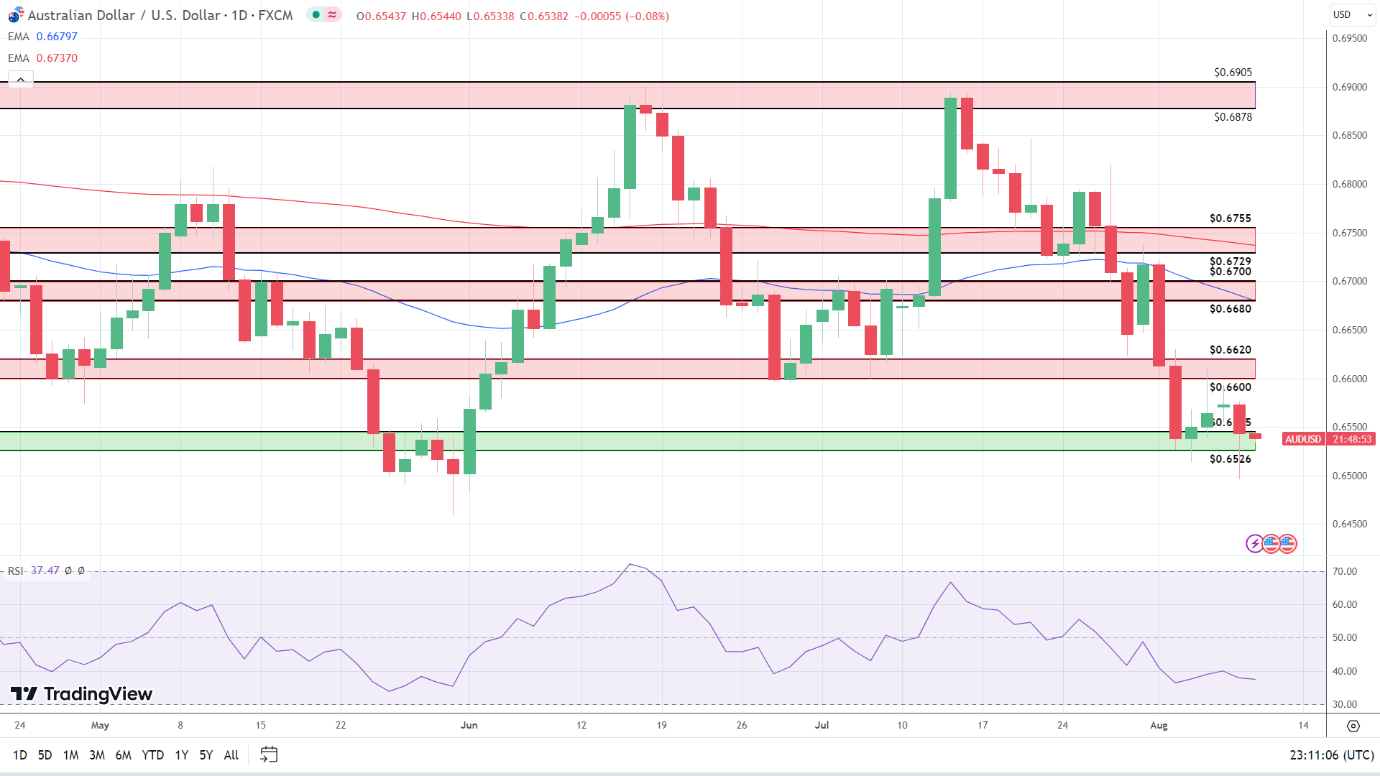
Daily Chart
The Daily Chart showed the AUD/USD hover at the upper level of the $0.6545 – $0.6526 support band. Significantly, the Aussie remained below the 50-day ($0.66797) and 200-day ($0.67370) EMAs, sending bearish near and longer-term price signals.
The 50-day EMA fell further from the 200-day EMA, sending bearish price signals.
Looking at the 14-Daily RSI, the 37.47 reading signals a bearish trend and supports a fall through the 0.6545 – 0.6526 support band to sub-$0.65. However, an AUD/USD move through the $0.6600 – $0.6620 resistance band would give the bulls a run at the $0.6680 – $0.6700 resistance band and the 50-day EMA ($0.66797).
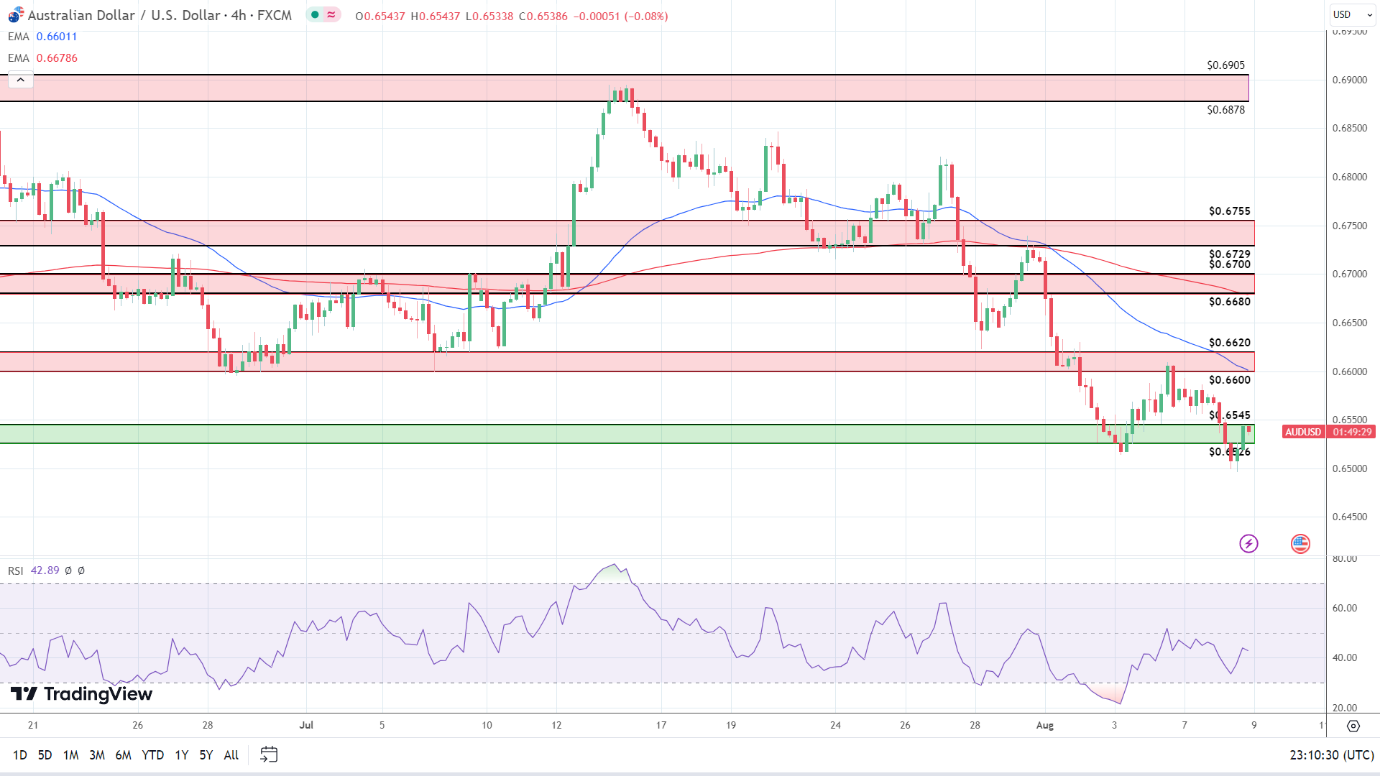
4-Hourly Chart
Looking at the 4-Hourly Chart, the AUD/USD hovers at the upper level of the $0.6545 – $0.6526 support band. Significantly, the AUD/USD remains below the 50-day ($0.66011) and 200-day ($0.66786) EMAs, sending bearish near and longer-term price signals.
The 50-day EMA pulled back from the 200-day EMA, supporting a fall through the $0.6545 – $0.6526 support band. However, an AUD/USD move through the lower level of the $0.6600 – $0.6620 resistance band and the 50-day EMA ($0.66011) would give the bulls a run at $0.6650.
Looking at the 14-4H RSI, the 42.89 reading reflects the bearish trend, with selling pressure outweighing buying pressure. The RSI aligns with the EMAs, signaling a fall through the $0.6545 – $0.6526 support band to sub-$0.65.
About the Author
Bob Masonauthor
With over 20 years of experience in the finance industry, Bob has been managing regional teams across Europe and Asia and focusing on analytics across both corporate and financial institutions. Currently he is covering developments relating to the financial markets, including currencies, commodities, alternative asset classes, and global equities.
Did you find this article useful?
Latest news and analysis


Advertisement